Unlock a world of possibilities! Login now and discover the exclusive benefits awaiting you.
- Qlik Community
- :
- Forums
- :
- Analytics & AI
- :
- Products & Topics
- :
- App Development
- :
- Master Item measure Colors based on fixed numeric ...
- Subscribe to RSS Feed
- Mark Topic as New
- Mark Topic as Read
- Float this Topic for Current User
- Bookmark
- Subscribe
- Mute
- Printer Friendly Page
- Mark as New
- Bookmark
- Subscribe
- Mute
- Subscribe to RSS Feed
- Permalink
- Report Inappropriate Content
Master Item measure Colors based on fixed numeric ranges (Visual clues in QV)
I have a master item measure: [Sum of Margin]. I want it to display green when positive, and red when negative. I used do this at the chart level in QV with visual cues, and setting numeric ranges.
It looks like the master item measure colors tab might do this, but I have tried adding and setting "limits', and cannot get this to do anything. Seems like it should be pretty simple, but the UI for this is not so intuitive for my feeble mind 😞
Dave
Accepted Solutions
- Mark as New
- Bookmark
- Subscribe
- Mute
- Subscribe to RSS Feed
- Permalink
- Report Inappropriate Content
Hi @dadumas
That makes more sense! You are asking about a table, and I had assumed it was a chart.
You need to write code to get colour in your table, and you sadly can't use the Master Measure colours. You need to use the colour expression boxes that you have found in your screenshot.
You can colour either the background or the text, to do it for the text you would have something like:
=if(sum(Value) < 0, rgb(200,0,0), rgb(0,200,0))
If you were looking to do it for the background you would want more pastel shades.
If you want to have gradiated colours you need to look up how to use the ColorMix1 and ColorMix2 functions, but they are not neccessary for a simple +/- colouring.
Hope that helps,
Steve
- Mark as New
- Bookmark
- Subscribe
- Mute
- Subscribe to RSS Feed
- Permalink
- Report Inappropriate Content
Hi @dadumas
You're on the right track. You need to ensure that you set the bounds for the limits correctly. It is also the case that the changes don't apply immediately. Drag the master measure onto the chart again and select to colour by the measure - that will often work. If not go to the Colours tab on the right hand properties menu and ensure Colour By Measure is selected and then switch the Library Colours switch on and off (or off and on). Hopefully the colours will kick in at some point.
Good luck!
Steve
- Mark as New
- Bookmark
- Subscribe
- Mute
- Subscribe to RSS Feed
- Permalink
- Report Inappropriate Content
Thanks Steve, I will try your suggestions
- Mark as New
- Bookmark
- Subscribe
- Mute
- Subscribe to RSS Feed
- Permalink
- Report Inappropriate Content
I have added limits for fixed value in the Master item - does nothing.
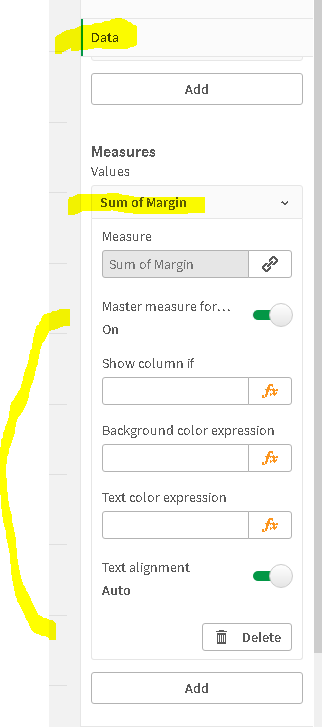
Also, I see no "color by the measure" option anywhere in properties. I have attached a screenshot of the measure properties in the chart where I use the master item. Am I looking in the right spot?
Dave
- Mark as New
- Bookmark
- Subscribe
- Mute
- Subscribe to RSS Feed
- Permalink
- Report Inappropriate Content
Hi @dadumas
That makes more sense! You are asking about a table, and I had assumed it was a chart.
You need to write code to get colour in your table, and you sadly can't use the Master Measure colours. You need to use the colour expression boxes that you have found in your screenshot.
You can colour either the background or the text, to do it for the text you would have something like:
=if(sum(Value) < 0, rgb(200,0,0), rgb(0,200,0))
If you were looking to do it for the background you would want more pastel shades.
If you want to have gradiated colours you need to look up how to use the ColorMix1 and ColorMix2 functions, but they are not neccessary for a simple +/- colouring.
Hope that helps,
Steve
- Mark as New
- Bookmark
- Subscribe
- Mute
- Subscribe to RSS Feed
- Permalink
- Report Inappropriate Content
That does help, so master items segment colors do not work in a tables or pivots. Yes, I have used that if() logic in QlikView, so would work the same here.
Thanks for noticing this.
Dave
Dave