Unlock a world of possibilities! Login now and discover the exclusive benefits awaiting you.
- Qlik Community
- :
- Forums
- :
- Analytics & AI
- :
- Products & Topics
- :
- App Development
- :
- Pivot Table and sub-totals by category
- Subscribe to RSS Feed
- Mark Topic as New
- Mark Topic as Read
- Float this Topic for Current User
- Bookmark
- Subscribe
- Mute
- Printer Friendly Page
- Mark as New
- Bookmark
- Subscribe
- Mute
- Subscribe to RSS Feed
- Permalink
- Report Inappropriate Content
Pivot Table and sub-totals by category
Hi all,
I have some troubles using the pivot table in Qlik Sense.
I'm using the pivot table in fully expended mode. My model here is pretty simple, 2 tables :
Table 1 is containing "banks" and table 2 is containing "assets", each asset is linked with 1 bank.
As you can see in the screen below, my bank rows in the table are displaying a "total" by bank. But this total here, is not the sum of all assets linked with this bank, but the average. I would like to display a simple sum instead of this average. Is it possible ?
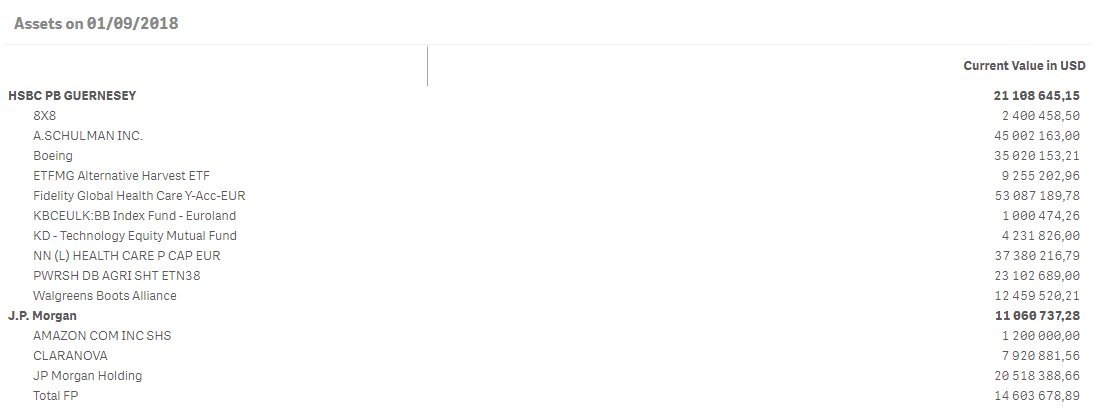
(don't worry the screen is displaying testing data)
Thanks for your help.
Accepted Solutions
- Mark as New
- Bookmark
- Subscribe
- Mute
- Subscribe to RSS Feed
- Permalink
- Report Inappropriate Content
Gregory Di Pasquale wrote:
Here is my code :
Sum({$<[asset_class] = {'Equity'}>}[asset_value])/Sum({$<[currency_id] = {$(=currencies)}>}currency_rate)
So you divide A by B. This is how your total is calculated as well.
- Mark as New
- Bookmark
- Subscribe
- Mute
- Subscribe to RSS Feed
- Permalink
- Report Inappropriate Content
What is your expression here? Is it AVG()? The total rows show the total values of the underlying rows, so if you calculate average, the totals will be average as well.
- Mark as New
- Bookmark
- Subscribe
- Mute
- Subscribe to RSS Feed
- Permalink
- Report Inappropriate Content
Here is my code :
Sum({$<[asset_class] = {'Equity'}>}[asset_value])/Sum({$<[currency_id] = {$(=currencies)}>}currency_rate)
- Mark as New
- Bookmark
- Subscribe
- Mute
- Subscribe to RSS Feed
- Permalink
- Report Inappropriate Content
Gregory Di Pasquale wrote:
Here is my code :
Sum({$<[asset_class] = {'Equity'}>}[asset_value])/Sum({$<[currency_id] = {$(=currencies)}>}currency_rate)
So you divide A by B. This is how your total is calculated as well.
- Mark as New
- Bookmark
- Subscribe
- Mute
- Subscribe to RSS Feed
- Permalink
- Report Inappropriate Content
Thanks you're right !
So now I need to find a way to apply my division.
This division is just a currency conversion, I need to use the currency_rate associated with the currency_id = $(=currencies), any idea ? (without using a Sum)
- Mark as New
- Bookmark
- Subscribe
- Mute
- Subscribe to RSS Feed
- Permalink
- Report Inappropriate Content
Maybe you can do the calculations in the script and have a filed showing the values in one currency. You can use ApplyMap to map the currency to the exchange rate.
A quick search in the community leads to this thread that can help you: How to use currency exchange rates in Qlik Sense