Unlock a world of possibilities! Login now and discover the exclusive benefits awaiting you.
- Qlik Community
- :
- Forums
- :
- Analytics & AI
- :
- Products & Topics
- :
- App Development
- :
- Re: Qlik Sense. Chart. Money value on axis
- Subscribe to RSS Feed
- Mark Topic as New
- Mark Topic as Read
- Float this Topic for Current User
- Bookmark
- Subscribe
- Mute
- Printer Friendly Page
- Mark as New
- Bookmark
- Subscribe
- Mute
- Subscribe to RSS Feed
- Permalink
- Report Inappropriate Content
Qlik Sense. Chart. Money value on axis
Hi.
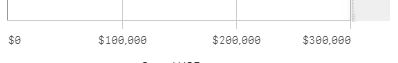
I need some help. Situation: exists charts, on y axis money dimension. How can I do format 250 000 to 250 K?
Thanks
Accepted Solutions
- Mark as New
- Bookmark
- Subscribe
- Mute
- Subscribe to RSS Feed
- Permalink
- Report Inappropriate Content
Click Range so it shows Custom
Click Min to Min/Max
Min = 0
Max = 300000
It should automatically use the K
- Mark as New
- Bookmark
- Subscribe
- Mute
- Subscribe to RSS Feed
- Permalink
- Report Inappropriate Content
Click Range so it shows Custom
Click Min to Min/Max
Min = 0
Max = 300000
It should automatically use the K
- Mark as New
- Bookmark
- Subscribe
- Mute
- Subscribe to RSS Feed
- Permalink
- Report Inappropriate Content
Hi @CathyRDuvall. Thanks for reply.
I have tried it. it didn;t work for me
Please look at screen in attachment
- Mark as New
- Bookmark
- Subscribe
- Mute
- Subscribe to RSS Feed
- Permalink
- Report Inappropriate Content
I would assume those are the measures, what are the dimensions?
Try going to Appearance /Presentation and change Vertical to Horizontal or visa versa.
- Mark as New
- Bookmark
- Subscribe
- Mute
- Subscribe to RSS Feed
- Permalink
- Report Inappropriate Content
@CathyRDuvall in dimension - date period. I tried to change - nothing happens.
- Mark as New
- Bookmark
- Subscribe
- Mute
- Subscribe to RSS Feed
- Permalink
- Report Inappropriate Content
Check your Data Load Editor and ensure this is in the SET clauses on the Main Page. It seems to be a recent add by QS.
SET NumericalAbbreviation='3:k;6:M;9:G;12:T;15:P;18:E;21:Z;24:Y;-3:m;-6:μ;-9:n;-12:p;-15:f;-18:a;-21:z;-24:y';
- Mark as New
- Bookmark
- Subscribe
- Mute
- Subscribe to RSS Feed
- Permalink
- Report Inappropriate Content
12:p
- Mark as New
- Bookmark
- Subscribe
- Mute
- Subscribe to RSS Feed
- Permalink
- Report Inappropriate Content
Second smiley face is Small p as in pan
- Mark as New
- Bookmark
- Subscribe
- Mute
- Subscribe to RSS Feed
- Permalink
- Report Inappropriate Content