Unlock a world of possibilities! Login now and discover the exclusive benefits awaiting you.
- Qlik Community
- :
- Forums
- :
- Analytics & AI
- :
- Products & Topics
- :
- App Development
- :
- QlikSense Missing Symbols vs QlikView
- Subscribe to RSS Feed
- Mark Topic as New
- Mark Topic as Read
- Float this Topic for Current User
- Bookmark
- Subscribe
- Mute
- Printer Friendly Page
- Mark as New
- Bookmark
- Subscribe
- Mute
- Subscribe to RSS Feed
- Permalink
- Report Inappropriate Content
QlikSense Missing Symbols vs QlikView
I am currently migrating a QV dashbaord to QS App and I've hit a bit of an issue with the visualisation
Currently in QV my pivot displays " " for missing values as i change the properites

So thePivot displays like this

In QS my pivot table is displaying "-"

Any ideas on how to change QS and the Users don't like having the Grey "-" in the Pivot Table
- « Previous Replies
-
- 1
- 2
- Next Replies »
- Mark as New
- Bookmark
- Subscribe
- Mute
- Subscribe to RSS Feed
- Permalink
- Report Inappropriate Content
Hi
do this
- Mark as New
- Bookmark
- Subscribe
- Mute
- Subscribe to RSS Feed
- Permalink
- Report Inappropriate Content
or try this
- Mark as New
- Bookmark
- Subscribe
- Mute
- Subscribe to RSS Feed
- Permalink
- Report Inappropriate Content
Hi
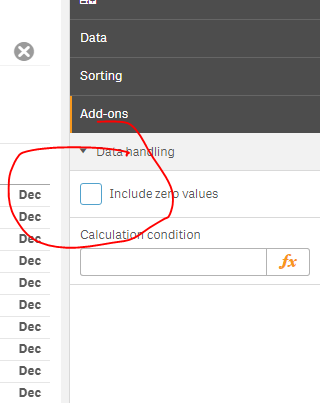
thanks for the reply, that doesn't work as it still shows the "-" and also i want to display the 0, i'm just looking for a way to change the missing symbol ftom "-" to " " or something similar

- Mark as New
- Bookmark
- Subscribe
- Mute
- Subscribe to RSS Feed
- Permalink
- Report Inappropriate Content
try this =Alt(yourexpression, 0)
- Mark as New
- Bookmark
- Subscribe
- Mute
- Subscribe to RSS Feed
- Permalink
- Report Inappropriate Content
or try
lF(IsNull(UrExp),0,UrExp)
or
NumSum(urExp)
hope this helps
- Mark as New
- Bookmark
- Subscribe
- Mute
- Subscribe to RSS Feed
- Permalink
- Report Inappropriate Content
i'm afraid Alt doesn't work either, i'm guessing because the value is missing for that Item Date combination
- Mark as New
- Bookmark
- Subscribe
- Mute
- Subscribe to RSS Feed
- Permalink
- Report Inappropriate Content
i tried this as well lF(IsNull(UrExp),0,UrExp)
The problem is value isn't Null is missing a combination so this sytax doesn't fit.
All we need is Qlik to add the functionality for Pivot tables from QV into QS and i wouldn't have this issue!!
- Mark as New
- Bookmark
- Subscribe
- Mute
- Subscribe to RSS Feed
- Permalink
- Report Inappropriate Content
can you share sample app?
- Mark as New
- Bookmark
- Subscribe
- Mute
- Subscribe to RSS Feed
- Permalink
- Report Inappropriate Content
what about
if(len(trim(UrExp))>0,UrExp,0)
- « Previous Replies
-
- 1
- 2
- Next Replies »