Unlock a world of possibilities! Login now and discover the exclusive benefits awaiting you.
- Qlik Community
- :
- Forums
- :
- Analytics & AI
- :
- Products & Topics
- :
- App Development
- :
- Re: Remove Labels from Pie Chart in Qliksense
- Subscribe to RSS Feed
- Mark Topic as New
- Mark Topic as Read
- Float this Topic for Current User
- Bookmark
- Subscribe
- Mute
- Printer Friendly Page
- Mark as New
- Bookmark
- Subscribe
- Mute
- Subscribe to RSS Feed
- Permalink
- Report Inappropriate Content
Remove Labels from Pie Chart in Qliksense
Hello All,
The Dimension has two values in it
Dimension-Criteria
1)RED-Management
2)Green-Management
I need to remove Labels from below Pie Chart
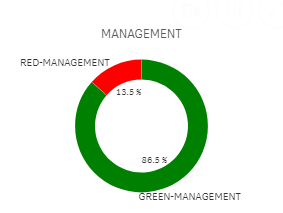
RED-Management and Green-Management shouldn't appear .Which option should i need to disable in Qliksense Pie Chart
Thanks
Accepted Solutions
- Mark as New
- Bookmark
- Subscribe
- Mute
- Subscribe to RSS Feed
- Permalink
- Report Inappropriate Content
- =if(YourField='Value1',' ',if(Yourfield='value2',' '))
- Mark as New
- Bookmark
- Subscribe
- Mute
- Subscribe to RSS Feed
- Permalink
- Report Inappropriate Content
- =if(YourField='Value1',' ',if(Yourfield='value2',' '))
- Mark as New
- Bookmark
- Subscribe
- Mute
- Subscribe to RSS Feed
- Permalink
- Report Inappropriate Content
Can't believe that there isn't just a check box to remove labels. Oh well.
The solution to have an increasing number of space characters for each wedge is a neat one Naveen. The only issue is that it will fail if there is a new dimension that you are not expecting.
By changing the expression to this it will cope with however many dimension values you have, and newly occurring dimensions:
=aggr(repeat(' ', Rank(sum(TestCount), 4)), Colour)
The sum(TestCount) part needs to be the expression on the pie, and Colour is the dimension.
Hope that helps.
Steve
- Mark as New
- Bookmark
- Subscribe
- Mute
- Subscribe to RSS Feed
- Permalink
- Report Inappropriate Content
2 alternative approaches is doing this in a theme or in the css of a mashup if embedding.
The problem with the "solution" is it also removes dimension label when hovering if they are all being set to blanks.
In a theme you can set the fontSize of the piechart-label to 0px.
In mashup you can turn off by targeting data-key="pie-labels"
Theme's json ex (note "fontSize": "0px"):
"object": {
"pieChart": {
"axis": {
"title": {
"fontSize": "12px"
}
},
"label": {
"name": {
"color": "@B20",
"fontSize": "0px"
},
"value": {
"fontSize": "12px"
}
}
}
In Mashup's css:
/*turn off pie chart labels*/
[data-key="pie-labels"] {
display:none
}
- Mark as New
- Bookmark
- Subscribe
- Mute
- Subscribe to RSS Feed
- Permalink
- Report Inappropriate Content
Something I needed today
7 years on and still no (native) solution;)
You can now change the colour to match the background, but no option to kill this off totally...😄