Unlock a world of possibilities! Login now and discover the exclusive benefits awaiting you.
- Qlik Community
- :
- Forums
- :
- Analytics & AI
- :
- Products & Topics
- :
- App Development
- :
- Requirement to autofit line chart in a single shee...
- Subscribe to RSS Feed
- Mark Topic as New
- Mark Topic as Read
- Float this Topic for Current User
- Bookmark
- Subscribe
- Mute
- Printer Friendly Page
- Mark as New
- Bookmark
- Subscribe
- Mute
- Subscribe to RSS Feed
- Permalink
- Report Inappropriate Content
Requirement to autofit line chart in a single sheet without scrolling
I need to display 92 days data in a single line chart with running sum in Qliksense. The line chart should fit in a single sheet, without scrolling to the right side.
Since there's no autofit option in the dimension or measure, I'm not able to achieve the formatting as desired. When I use the function odd or even to limit the days then the running sum is not working properly.
Kindly provide a solution where the line chart should either fit automatically into a single sheet or the running sum should take the data only for odd/even days.
Accepted Solutions
- Mark as New
- Bookmark
- Subscribe
- Mute
- Subscribe to RSS Feed
- Permalink
- Report Inappropriate Content
Hello,
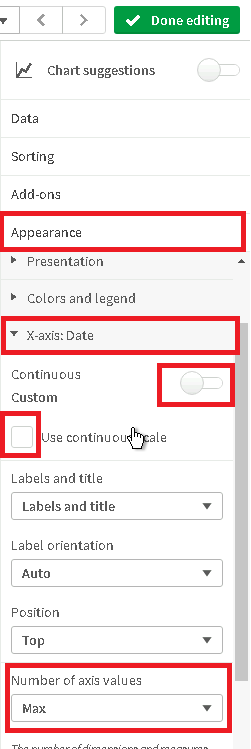
On my side when using Line chart, I was able to see the entire chart without scrolling, even though I had 100 days of data. You can try modifying the following settings:
- In Appearance > X-axis
- Un-check option "Continuous"
- Un-check option "Use continuous scale"
- Number of axis values: Max
- This should show all the data on the chart and remove the scroll option entirely:
I hope that this information was helpful. In case I have misunderstood the use case scenario, please elaborate in details by providing additional information. However, if it has helped you resolve the issue, addressed your concerns or at least pointed you in the right direction, please mark it as Accepted Solution to give further visibility to other community members.
- Mark as New
- Bookmark
- Subscribe
- Mute
- Subscribe to RSS Feed
- Permalink
- Report Inappropriate Content
Hello,
On my side when using Line chart, I was able to see the entire chart without scrolling, even though I had 100 days of data. You can try modifying the following settings:
- In Appearance > X-axis
- Un-check option "Continuous"
- Un-check option "Use continuous scale"
- Number of axis values: Max
- This should show all the data on the chart and remove the scroll option entirely:
I hope that this information was helpful. In case I have misunderstood the use case scenario, please elaborate in details by providing additional information. However, if it has helped you resolve the issue, addressed your concerns or at least pointed you in the right direction, please mark it as Accepted Solution to give further visibility to other community members.