Unlock a world of possibilities! Login now and discover the exclusive benefits awaiting you.
- Qlik Community
- :
- Forums
- :
- Analytics & AI
- :
- Products & Topics
- :
- App Development
- :
- Set color by expression (2 measures) - line chart
- Subscribe to RSS Feed
- Mark Topic as New
- Mark Topic as Read
- Float this Topic for Current User
- Bookmark
- Subscribe
- Mute
- Printer Friendly Page
- Mark as New
- Bookmark
- Subscribe
- Mute
- Subscribe to RSS Feed
- Permalink
- Report Inappropriate Content
Set color by expression (2 measures) - line chart
Hi,
I am trying to set green for "Cumplido" (Compliment) and red for "Cancelado" ("Canceled").
My measures are:
Cumplido:
SUM(FLAG_CUMPLIDO)
Cancelado:
SUM(FLAG_CANCELADO)
About the data:
If FLAG_CUMPLIDO = 1 then FLAG_CANCELADO = null and if FLAG_CANCELADO = 1 then FLAG_CUMPLIDO = null
Anyone has solved this kind of problem?
- Mark as New
- Bookmark
- Subscribe
- Mute
- Subscribe to RSS Feed
- Permalink
- Report Inappropriate Content
Not sure I understand your issue, can you elaborate or share a sample?
- Mark as New
- Bookmark
- Subscribe
- Mute
- Subscribe to RSS Feed
- Permalink
- Report Inappropriate Content
Hi Sunny,
This is my chart:
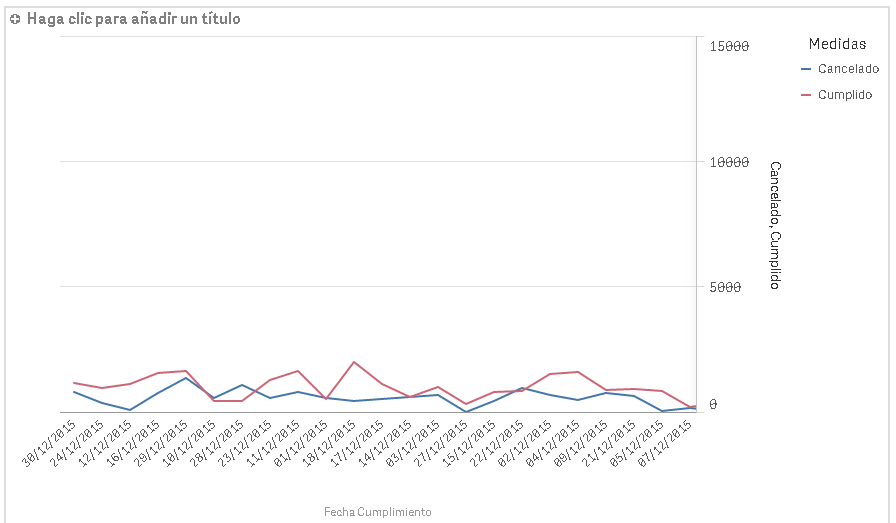
The red line (Cumplido) should be green and the blue (Cancelado) should be red.
I can't set by expression the colours right.
Sorry if my english is bad.
- Mark as New
- Bookmark
- Subscribe
- Mute
- Subscribe to RSS Feed
- Permalink
- Report Inappropriate Content
A simple fix is to swap around your measures.
- Mark as New
- Bookmark
- Subscribe
- Mute
- Subscribe to RSS Feed
- Permalink
- Report Inappropriate Content
OK... but... how I set the green colour?