Unlock a world of possibilities! Login now and discover the exclusive benefits awaiting you.
Announcements
Qlik and ServiceNow Partner to Bring Trusted Enterprise Context into AI-Powered Workflows. Learn More!
- Qlik Community
- :
- Forums
- :
- Analytics & AI
- :
- Products & Topics
- :
- App Development
- :
- Show desired data in reduced graphics (Qlik Sense)
Options
- Subscribe to RSS Feed
- Mark Topic as New
- Mark Topic as Read
- Float this Topic for Current User
- Bookmark
- Subscribe
- Mute
- Printer Friendly Page
Turn on suggestions
Auto-suggest helps you quickly narrow down your search results by suggesting possible matches as you type.
Showing results for
Not applicable
2016-04-05
07:47 PM
- Mark as New
- Bookmark
- Subscribe
- Mute
- Subscribe to RSS Feed
- Permalink
- Report Inappropriate Content
Show desired data in reduced graphics (Qlik Sense)
Hi
I made a dashboard and some of the bar/line charts have a 12 months period history of data.
As expected, it shows only a few months - from March of last year until September. To see the remaining bars I need to use the scroll bar or to expand it to a full window view.
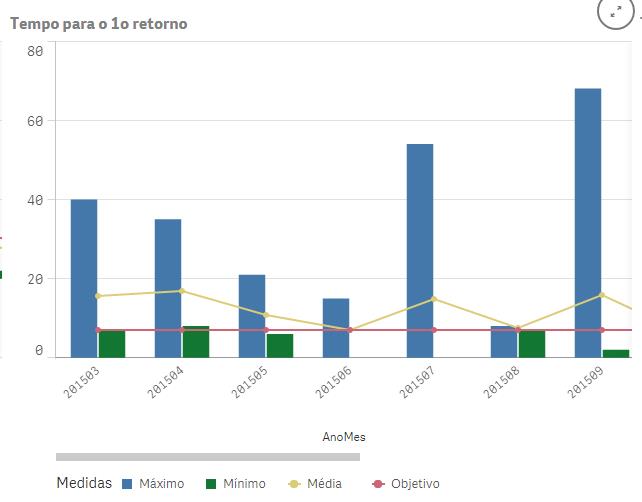
However, as a fast dashboard view, I should have the most recent dates instead of the older ones.
I tried to reverse the order of the months, but the General Manager refused as he is used to see dates from left to right.
Is there any way to show as default the right values of the graph instead of the left ones?
Thank you
Rui
- Tags:
- graph scrolling
370 Views
0 Replies