Unlock a world of possibilities! Login now and discover the exclusive benefits awaiting you.
- Qlik Community
- :
- Forums
- :
- Analytics & AI
- :
- Products & Topics
- :
- App Development
- :
- Re: Stacked Bar Chart Legend with Custom Colors
- Subscribe to RSS Feed
- Mark Topic as New
- Mark Topic as Read
- Float this Topic for Current User
- Bookmark
- Subscribe
- Mute
- Printer Friendly Page
- Mark as New
- Bookmark
- Subscribe
- Mute
- Subscribe to RSS Feed
- Permalink
- Report Inappropriate Content
Stacked Bar Chart Legend with Custom Colors
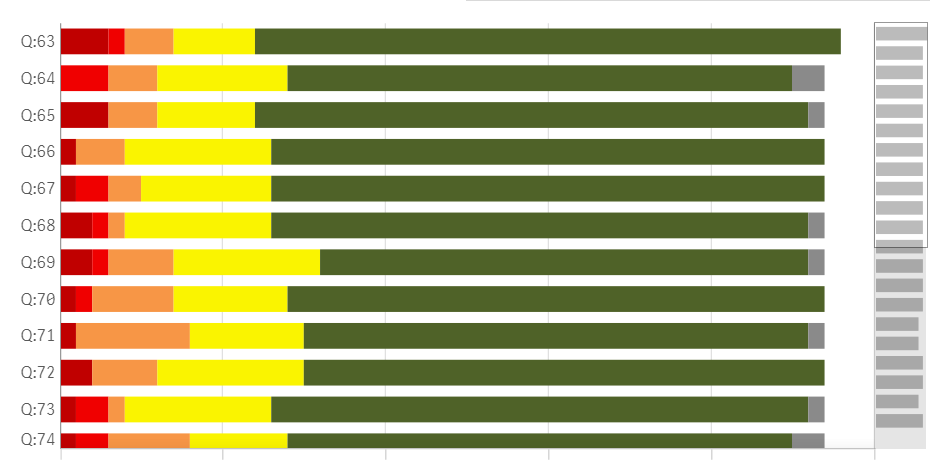
I have a stacked bar chart with custom colors. However, when I am using custom colors the option to also display a legend disappears. Is there any way to have a legend show up even though I am using custom colors?
- « Previous Replies
-
- 1
- 2
- Next Replies »
- Mark as New
- Bookmark
- Subscribe
- Mute
- Subscribe to RSS Feed
- Permalink
- Report Inappropriate Content
I don't know a way to pull the colors from the Master dimension.
But what you can try is giving in the RGB code in the script.
Example
So in my app I have data from age by gender.
In the script i added:
Color:
Load * Inline [
Sex, Color
Male, 'RGB(0,0,255)'
Female, 'RGB(255,0,0)'
];
And in my background expression i used:
If(Wildmatch(Sex, '*ale'), Color, Lightgray())
that resulted in this:
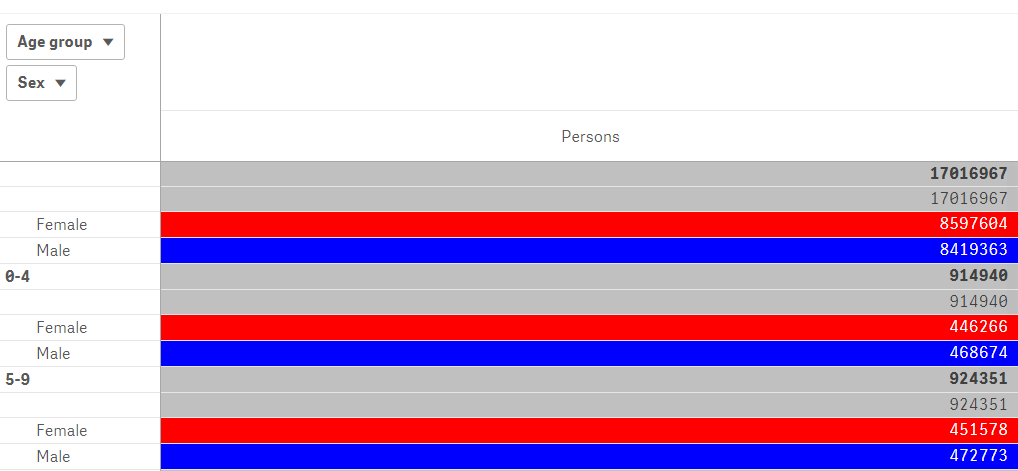
Is this what you are looking for?
- Mark as New
- Bookmark
- Subscribe
- Mute
- Subscribe to RSS Feed
- Permalink
- Report Inappropriate Content
Yeah, that's exactly the strategy I've implemented in my app 
I've used the Master dimension colors to use in bar charts, and RGBs in script for the same dimension that match Master dim colors - for background color expressions.
Thanks for all your help!
- Mark as New
- Bookmark
- Subscribe
- Mute
- Subscribe to RSS Feed
- Permalink
- Report Inappropriate Content
Hi,
I have same problem of giving legends to stacked bar chart . Here i have used colour by expression so that legends are not visible.
Is there any extension for this to do?
Thanks,
sai
- Mark as New
- Bookmark
- Subscribe
- Mute
- Subscribe to RSS Feed
- Permalink
- Report Inappropriate Content
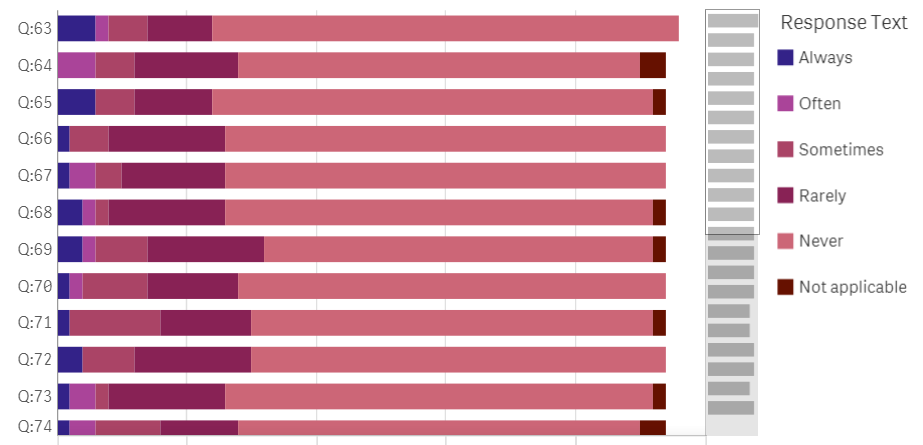
Hi, the only way i found to do this, was creating a meassure in master items and assigning the color to this.
- « Previous Replies
-
- 1
- 2
- Next Replies »