- Mark as New
- Bookmark
- Subscribe
- Mute
- Subscribe to RSS Feed
- Permalink
- Report Inappropriate Content
Totals in a table as a KPI
Hi everybody,
I've beeing reading lot of posts to find an answer to my doubt but I can´t reach the right one, so I decided to make a post.
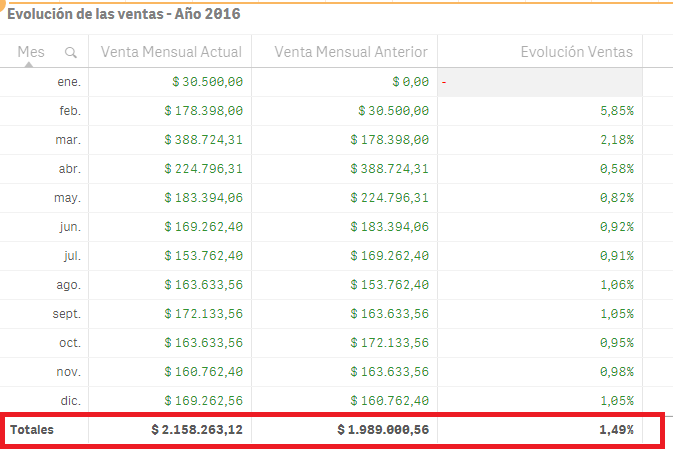
I have this table:

Where:
Venta Mensual actual = Sum(IF(IDCuentaContable=40, Monto))
Venta mensual Anterior = Sum(IF(IDCuentaContable=40, MontoAnterior))
Evolucion ventas = Sum(IF(IDCuentaContable=40, Monto))/Sum(IF(IDCuentaContable=40, MontoAnterior))/100
All of them are master elements.
I need to filter only account No 40.
Monto Anterior was created from script as follow:
IF(((Mes-1)=0),0, (Previous(Monto))) as MontoAnterior
I want to show the Total of Evolucion Ventas (1.49%) as a KPI
I've tried with a lot of functions but I can´t do it.
Could I have some help? I´m making my first steps with Qlik Sense
Accepted Solutions
- Mark as New
- Bookmark
- Subscribe
- Mute
- Subscribe to RSS Feed
- Permalink
- Report Inappropriate Content
Try this
Avg(Aggr(Sum({<IDCuentaContable={40}>}Monto)/Sum({<IDCuentaContable={40}>}MontoAnterior)/100, Mes))
- Mark as New
- Bookmark
- Subscribe
- Mute
- Subscribe to RSS Feed
- Permalink
- Report Inappropriate Content
What is the total mode for Evolucion Ventas measure?
- Mark as New
- Bookmark
- Subscribe
- Mute
- Subscribe to RSS Feed
- Permalink
- Report Inappropriate Content
Hi Sunny,
I´m not sure what your question is.
I need to show the red mark as a KPI

I put the script in my previous post
- Mark as New
- Bookmark
- Subscribe
- Mute
- Subscribe to RSS Feed
- Permalink
- Report Inappropriate Content
I am not sure how you are calculating 1.49%... can you explain how you get this number?
- Mark as New
- Bookmark
- Subscribe
- Mute
- Subscribe to RSS Feed
- Permalink
- Report Inappropriate Content
Hi fabianaiglesias,
i'm pretty new myself but since you just need the totals as a kpi couldn't you just put your function:
Sum(IF(IDCuentaContable=40, Monto))/Sum(IF(IDCuentaContable=40, MontoAnterior))/100
into a kpi and get the right result. since the only real difference in the table is that it is grouped by a dimension months.
i would also stongly recommend you don't use The IF function inside a sum of any other aggragation function as this severely slows down your front end application. so your set analysis should look like this:
sum({<IDCuentaContable = {40}>}, Monto)/ sum({<IDCuentaContable=40>}, MontoAnterior)/100
Elsewise if this doesn't work i think you can do something like this
sum(aggr(months, sum({<IDCuentaContable = {40}>}, Monto)/ sum({<IDCuentaContable=40>}, MontoAnterior)/100))
this wil first create a table with all evolucion ventas per month and then just make the sum out of it.
Could be i'm misinterpreting your question so pleas elaborate if this is wrong ![]()
- Mark as New
- Bookmark
- Subscribe
- Mute
- Subscribe to RSS Feed
- Permalink
- Report Inappropriate Content
Hi Sunny, let me explain you a bit more.
This is the complete table:

"Totales" is automatically calculated by Qlik
I made the same process in excel and the values are right
I need to reproduce them in KPIs
- Mark as New
- Bookmark
- Subscribe
- Mute
- Subscribe to RSS Feed
- Permalink
- Report Inappropriate Content
Hi Jelle,
thanks for you advice with IF function!
I tried the options you gave me and these was the results:
1) The script Sum({<IDCuentaContable={40}>}Monto)/Sum({<IDCuentaContable={40}>}MontoAnterior)/100 results in differences between the KPI and the column "Evolucion ventas" as show:

And I noticed this:
if you do 2.158.263,13 / 1.989.000.56 the result is 1.09%
But, if you calculate the average of Evolucion Ventas column, the result will be 1.49%
So I guess that I need to make an script to calculate the average of the last column (take in account that Totales are automatically calculated by Qlik). And if you repete these calculus in excel they are correct
2) The second script didn´t work:
Sum(aggr(Mes, (sum({<IDCuentaContable = {40}>} Monto)/ sum({<IDCuentaContable={40}>} MontoAnterior)/100)))

- Mark as New
- Bookmark
- Subscribe
- Mute
- Subscribe to RSS Feed
- Permalink
- Report Inappropriate Content
Try this
Avg(Aggr(Sum({<IDCuentaContable={40}>}Monto)/Sum({<IDCuentaContable={40}>}MontoAnterior)/100, Mes))
- Mark as New
- Bookmark
- Subscribe
- Mute
- Subscribe to RSS Feed
- Permalink
- Report Inappropriate Content
Did you give this a shot?
Avg(Aggr(Sum({<IDCuentaContable={40}>}Monto)/Sum({<IDCuentaContable={40}>}MontoAnterior)/100, Mes))
- Mark as New
- Bookmark
- Subscribe
- Mute
- Subscribe to RSS Feed
- Permalink
- Report Inappropriate Content
Thank you Sunny, your script worked!!
I really appreciate you help!