Unlock a world of possibilities! Login now and discover the exclusive benefits awaiting you.
- Qlik Community
- :
- Forums
- :
- Analytics
- :
- App Development
- :
- Trending of sales
- Subscribe to RSS Feed
- Mark Topic as New
- Mark Topic as Read
- Float this Topic for Current User
- Bookmark
- Subscribe
- Mute
- Printer Friendly Page
- Mark as New
- Bookmark
- Subscribe
- Mute
- Subscribe to RSS Feed
- Permalink
- Report Inappropriate Content
Trending of sales
Hi, I've got a field called TRENDING CODES.
In this field I've got the following values:
1. MFGTYPE
2. PACKSIZE
each of the above mentioned fields are then linked to anothre table called dimension values.
so basically it can be broken down as follows:
1. MFGTYPE:
a. hand pack
b. machine pack
2. PACKSIZE:
a. 30g
b. 100g
c. 450 g
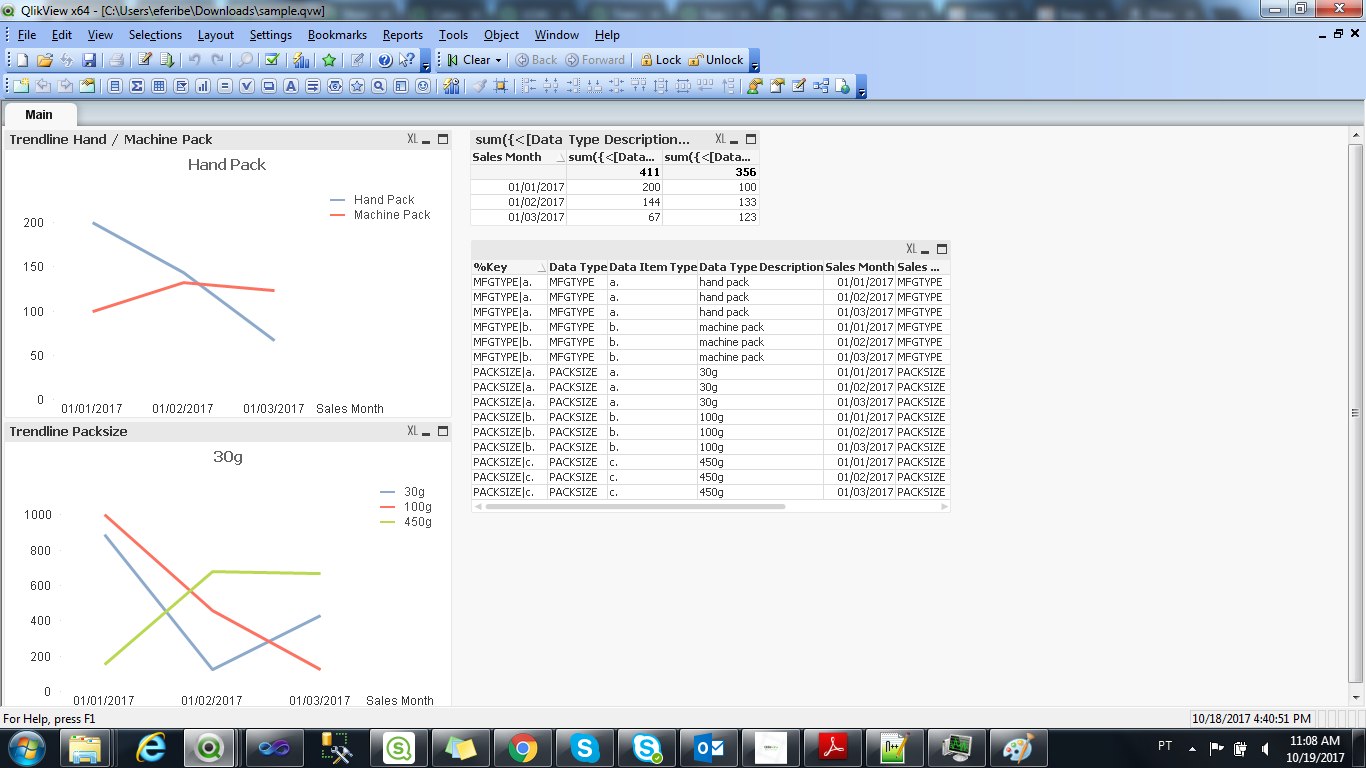
i would like to create a trending chart where i group the sum of sales per month for MFGTYPE hand pack vs machine pack
and then another chart where i compare the same as above, but only for the pack sizes.
how do i do this on the object in my design?????
Accepted Solutions
- Mark as New
- Bookmark
- Subscribe
- Mute
- Subscribe to RSS Feed
- Permalink
- Report Inappropriate Content
Sure Rani,

Code for this is in the Sample.txt file and expression in Expressions.txt.
Felipe.
- Mark as New
- Bookmark
- Subscribe
- Mute
- Subscribe to RSS Feed
- Permalink
- Report Inappropriate Content
Hi Rani,
You would need to use set analysis for this.
I've attached a sample QVW with some dummy data for you so that you can see how it's done.
Felipe.
- Mark as New
- Bookmark
- Subscribe
- Mute
- Subscribe to RSS Feed
- Permalink
- Report Inappropriate Content
Hi Felip,
I cannot open the file, due to it not being created on my personal computer.
could you perhaps send a screenshot?
- Mark as New
- Bookmark
- Subscribe
- Mute
- Subscribe to RSS Feed
- Permalink
- Report Inappropriate Content
Sure Rani,

Code for this is in the Sample.txt file and expression in Expressions.txt.
Felipe.
- Mark as New
- Bookmark
- Subscribe
- Mute
- Subscribe to RSS Feed
- Permalink
- Report Inappropriate Content
THANK YOU VERY MUCH!
- Mark as New
- Bookmark
- Subscribe
- Mute
- Subscribe to RSS Feed
- Permalink
- Report Inappropriate Content
No problem, glad to help ![]() .
.
- Mark as New
- Bookmark
- Subscribe
- Mute
- Subscribe to RSS Feed
- Permalink
- Report Inappropriate Content
Hi there,
I've got one more question.
what will my expression look like if I want to add another condition to it.. for example:
sum of the machine pack sales specifically for the WWS business unit?
- Mark as New
- Bookmark
- Subscribe
- Mute
- Subscribe to RSS Feed
- Permalink
- Report Inappropriate Content
Hi Rani,
Would be something like this:
sum({<[Data Type Description]={"machine pack"},[Business Unit]={"WWS"}>}[Sales Value])
Felipe.