Unlock a world of possibilities! Login now and discover the exclusive benefits awaiting you.
- Qlik Community
- :
- Forums
- :
- Analytics & AI
- :
- Products & Topics
- :
- App Development
- :
- Value labels for markers in a Combo charts
- Subscribe to RSS Feed
- Mark Topic as New
- Mark Topic as Read
- Float this Topic for Current User
- Bookmark
- Subscribe
- Mute
- Printer Friendly Page
- Mark as New
- Bookmark
- Subscribe
- Mute
- Subscribe to RSS Feed
- Permalink
- Report Inappropriate Content
Value labels for markers in a Combo charts
Hello,
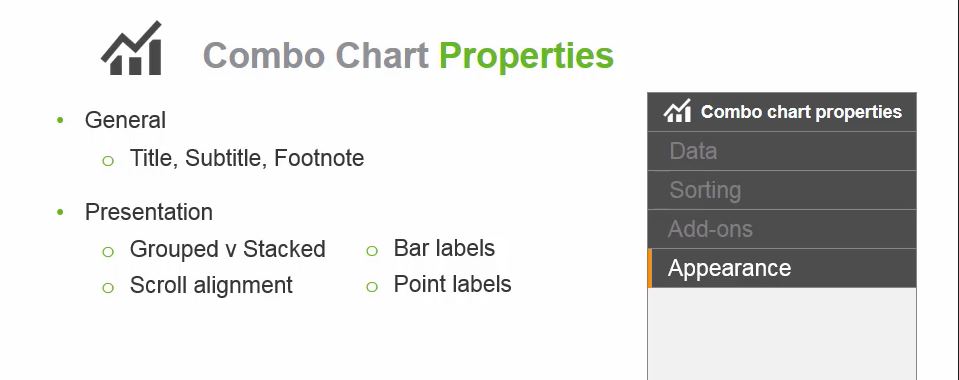
I'm trying to insert value labels for markers in a combo chart (in Qlik Sense) and even though the Qlik Continuous Classroom training video on Combo charts show that it's possible (see screen shot below), I'm unable to find the "point labels" option.
Anyone else encountered a similar issue?
- Mark as New
- Bookmark
- Subscribe
- Mute
- Subscribe to RSS Feed
- Permalink
- Report Inappropriate Content
Hi! You need to click on "show data points" first, then the option appears.
- Mark as New
- Bookmark
- Subscribe
- Mute
- Subscribe to RSS Feed
- Permalink
- Report Inappropriate Content
Hi Ivan, thanks a lot for your suggestion. However that is only available if you use "Line". I'm using "Markers" as it's more appropriate to the content.
Is there a way to label the markers?
- Mark as New
- Bookmark
- Subscribe
- Mute
- Subscribe to RSS Feed
- Permalink
- Report Inappropriate Content
No, It is not possible to show labels for measures shown as markers.
- Mark as New
- Bookmark
- Subscribe
- Mute
- Subscribe to RSS Feed
- Permalink
- Report Inappropriate Content
Thanks Ivan!
- Mark as New
- Bookmark
- Subscribe
- Mute
- Subscribe to RSS Feed
- Permalink
- Report Inappropriate Content
With the latest versions of QS, a workaround for this is to create an additional expression on top, which happens to be exactly the same, but display it as a line.
Then, on the colour options for this new expression, set the colour to be =ARGB(0,0,0,0) to make the line transparent. After that, you can enable the 'Point labels' option under Presentation tab.