Unlock a world of possibilities! Login now and discover the exclusive benefits awaiting you.
- Qlik Community
- :
- Forums
- :
- Analytics & AI
- :
- Products & Topics
- :
- App Development
- :
- Re: Why are some of the data points shown as grey ...
- Subscribe to RSS Feed
- Mark Topic as New
- Mark Topic as Read
- Float this Topic for Current User
- Bookmark
- Subscribe
- Mute
- Printer Friendly Page
- Mark as New
- Bookmark
- Subscribe
- Mute
- Subscribe to RSS Feed
- Permalink
- Report Inappropriate Content
Why are some of the data points shown as grey triangles instead of dots?
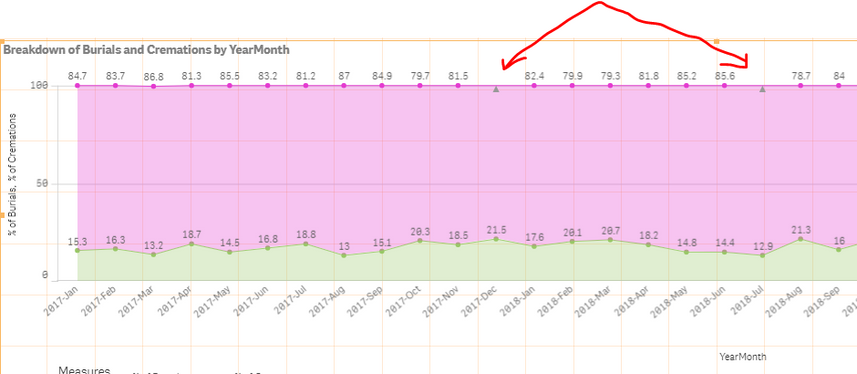
Hi folks, I were asked about why some of the data points in the Qlik Sense line chart are shown as grey triangles instead of dots? When hover over it, the data can be shown available. How should I explain for the absence of the dots?
Accepted Solutions
- Mark as New
- Bookmark
- Subscribe
- Mute
- Subscribe to RSS Feed
- Permalink
- Report Inappropriate Content
Hi,
This generally happens when values goes above the defined limit in chart. I assume you have defined a limit on Y axis.
Regards,
Prashant
- Mark as New
- Bookmark
- Subscribe
- Mute
- Subscribe to RSS Feed
- Permalink
- Report Inappropriate Content
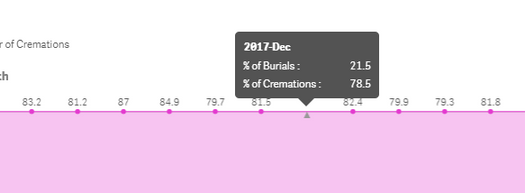
It could be an rounding error. 21.5 could be any number between 21.45 and 21.54and 78.5 between 78.45 and 78.54.
TTry to set your Y axis max limit to 100.1
Qlik Community MVP
- Mark as New
- Bookmark
- Subscribe
- Mute
- Subscribe to RSS Feed
- Permalink
- Report Inappropriate Content
Hi,
This generally happens when values goes above the defined limit in chart. I assume you have defined a limit on Y axis.
Regards,
Prashant
- Mark as New
- Bookmark
- Subscribe
- Mute
- Subscribe to RSS Feed
- Permalink
- Report Inappropriate Content
Hi Prashant,
The value (78.5) is actually below those points that can be shown with dots. Below is a screenshot with the hover text.
- Mark as New
- Bookmark
- Subscribe
- Mute
- Subscribe to RSS Feed
- Permalink
- Report Inappropriate Content
It could be an rounding error. 21.5 could be any number between 21.45 and 21.54and 78.5 between 78.45 and 78.54.
TTry to set your Y axis max limit to 100.1
Qlik Community MVP
- Mark as New
- Bookmark
- Subscribe
- Mute
- Subscribe to RSS Feed
- Permalink
- Report Inappropriate Content
Thanks Vegar and Prashant, it works after I change the Y axis limit to 100.1

