Unlock a world of possibilities! Login now and discover the exclusive benefits awaiting you.
- Qlik Community
- :
- Forums
- :
- Analytics & AI
- :
- Products & Topics
- :
- App Development
- :
- combo chart color measures by expression
- Subscribe to RSS Feed
- Mark Topic as New
- Mark Topic as Read
- Float this Topic for Current User
- Bookmark
- Subscribe
- Mute
- Printer Friendly Page
- Mark as New
- Bookmark
- Subscribe
- Mute
- Subscribe to RSS Feed
- Permalink
- Report Inappropriate Content
combo chart color measures by expression
i'm using a combo chart to display two measures. the two measure expressions are:
sum(if([Availability woMW Severity]='Major',1,0))
sum(if([Availability woMW Severity]='Minor',1,0))
the resulting graph is:
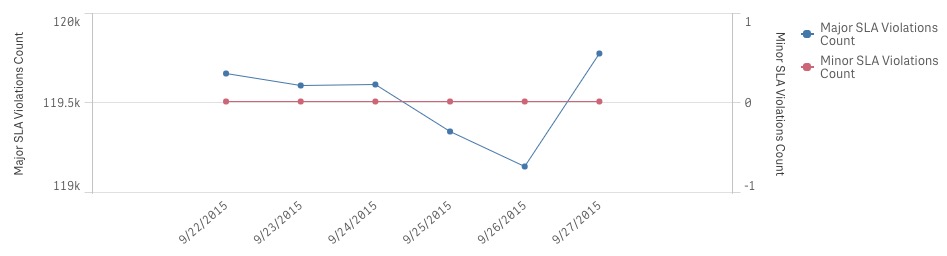
i need to assign a specific color to each line. using the color by expression. i tried a few iterations of the following, but it's not doing it for me. any suggestions?
if("Availability woMW Severity"='Major',RGB(255,0,0),if("Availability woMW Severity"='Minor',RGB(255,165,0)))
is there a way to refer to a measure in an expression by using it's label, etc? i.e. the two measures have labels "Major count" and "Minor count". wondering if there's a function that allows something along the lines of if(MeasureLabel = "Major count",red,if(MeasureLabel = "Minor count",orange))
- « Previous Replies
-
- 1
- 2
- Next Replies »
- Mark as New
- Bookmark
- Subscribe
- Mute
- Subscribe to RSS Feed
- Permalink
- Report Inappropriate Content
hi, this would be really useful - is it available yet?
I have a line chart with two measures that show 'Actual LTD' & 'Target LTD' by month.
I simply want to gray-out those months prior to the current year-month selection. This part I can do ok, but I can't figure how to set a different colour for each measure in the 'else' part of the If statement?
- « Previous Replies
-
- 1
- 2
- Next Replies »