Unlock a world of possibilities! Login now and discover the exclusive benefits awaiting you.
- Qlik Community
- :
- Forums
- :
- Analytics & AI
- :
- Products & Topics
- :
- App Development
- :
- how to add a manual column in pivot table
- Subscribe to RSS Feed
- Mark Topic as New
- Mark Topic as Read
- Float this Topic for Current User
- Bookmark
- Subscribe
- Mute
- Printer Friendly Page
- Mark as New
- Bookmark
- Subscribe
- Mute
- Subscribe to RSS Feed
- Permalink
- Report Inappropriate Content
how to add a manual column in pivot table
Hello Friends,
I am creating a pivot table where I have one column "SLA Description" in Rows section with below code:
=ValueList('Demand ASA','First Tier Resolution','Incident P1 Response Critical')
with that a month column and a measure using pick(match()) function.
I want to add one more column under Rows "SLA Threshold" using below code:
=Pick(Match(ValueList('Demand ASA','First Tier Resolution','Incident P1 Response Critical')
,'Demand ASA','First Tier Resolution','Incident P1 Response Critical'),
Col1,Col2,Col3)
but it is not displaying anything. Col1,2,3 values are coming directly from a excel file.
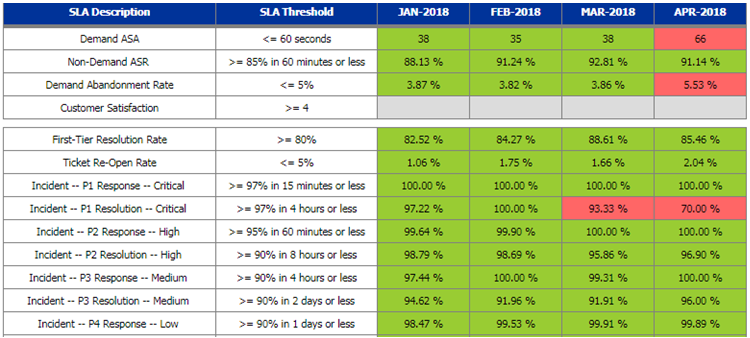
My ultimate aim is below table:
Any help would be great.
Regards,
Tauceef
Accepted Solutions
- Mark as New
- Bookmark
- Subscribe
- Mute
- Subscribe to RSS Feed
- Permalink
- Report Inappropriate Content
Have solved the issue by creating a temporary table using inline load for "SLA Description" values and used this in "IF" condition to create "SLA Threshold" column, that way it works.
Regards,
Tauceef