Unlock a world of possibilities! Login now and discover the exclusive benefits awaiting you.
Announcements
Now accepting applications for the Qlik Luminary and Partner Ambassador Programs: Apply by July 6!
- Qlik Community
- :
- Forums
- :
- Analytics & AI
- :
- Products & Topics
- :
- App Development
- :
- measure expression and dimension in pie chart
Options
- Subscribe to RSS Feed
- Mark Topic as New
- Mark Topic as Read
- Float this Topic for Current User
- Bookmark
- Subscribe
- Mute
- Printer Friendly Page
Turn on suggestions
Auto-suggest helps you quickly narrow down your search results by suggesting possible matches as you type.
Showing results for
Contributor
2019-07-12
03:24 AM
- Mark as New
- Bookmark
- Subscribe
- Mute
- Subscribe to RSS Feed
- Permalink
- Report Inappropriate Content
measure expression and dimension in pie chart
I want a percentage, that work also as a filter for this thing. Here this is an example of the table.
| CodOffice | IdPractice |
| 101 | 54645 |
| 101 | 123546 |
| 102 | - |
| 103 | 4568 |
| 104 | 7987 |
In my pie chart a want a percentage of how many CodOffice have at least one IdPractice and how many CodOffice don't have an IdPractice
1,771 Views
1 Reply
Contributor III
2019-07-26
03:45 PM
- Mark as New
- Bookmark
- Subscribe
- Mute
- Subscribe to RSS Feed
- Permalink
- Report Inappropriate Content
Hi Marco,
Maybe this can help you.
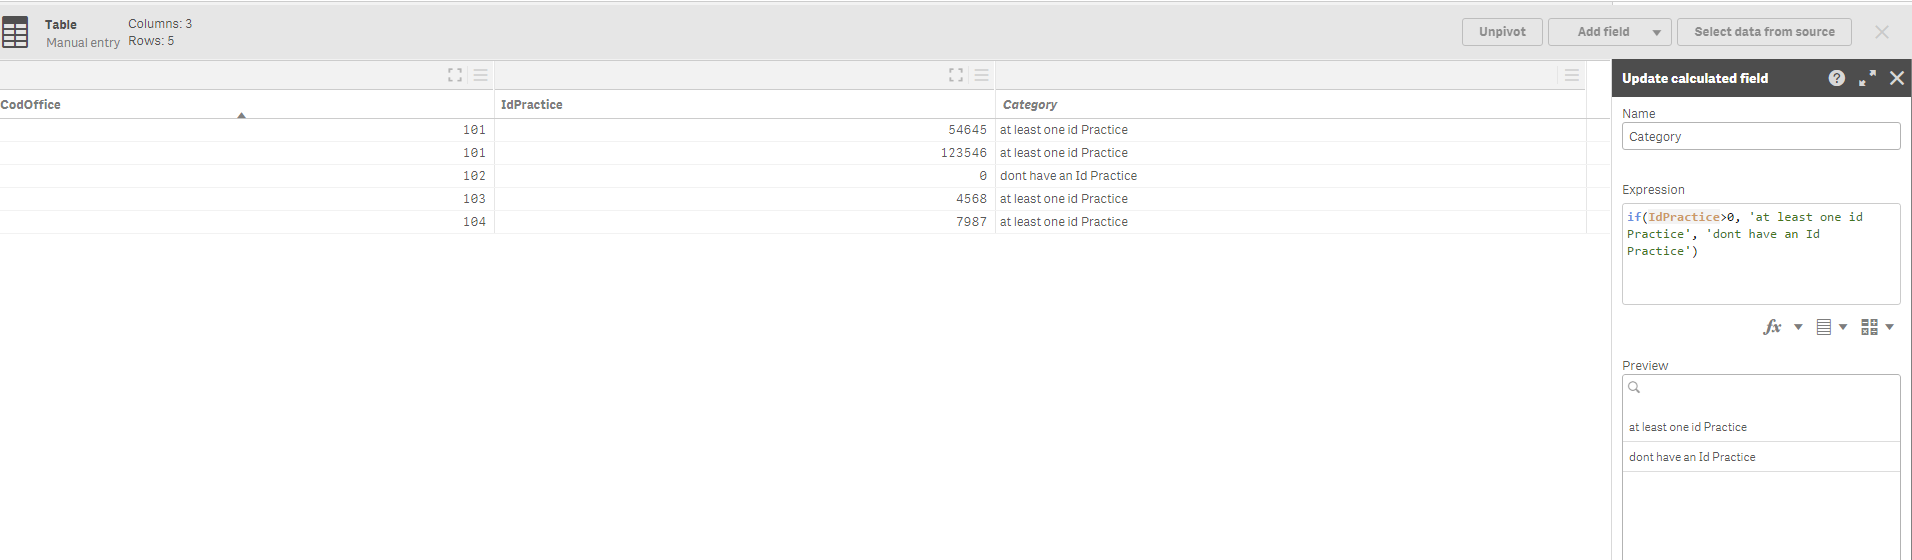
1. you can add a category calculated with a formula: if([IdPractice]>0, 'at least one id Practice', 'dont have an Id Practice')
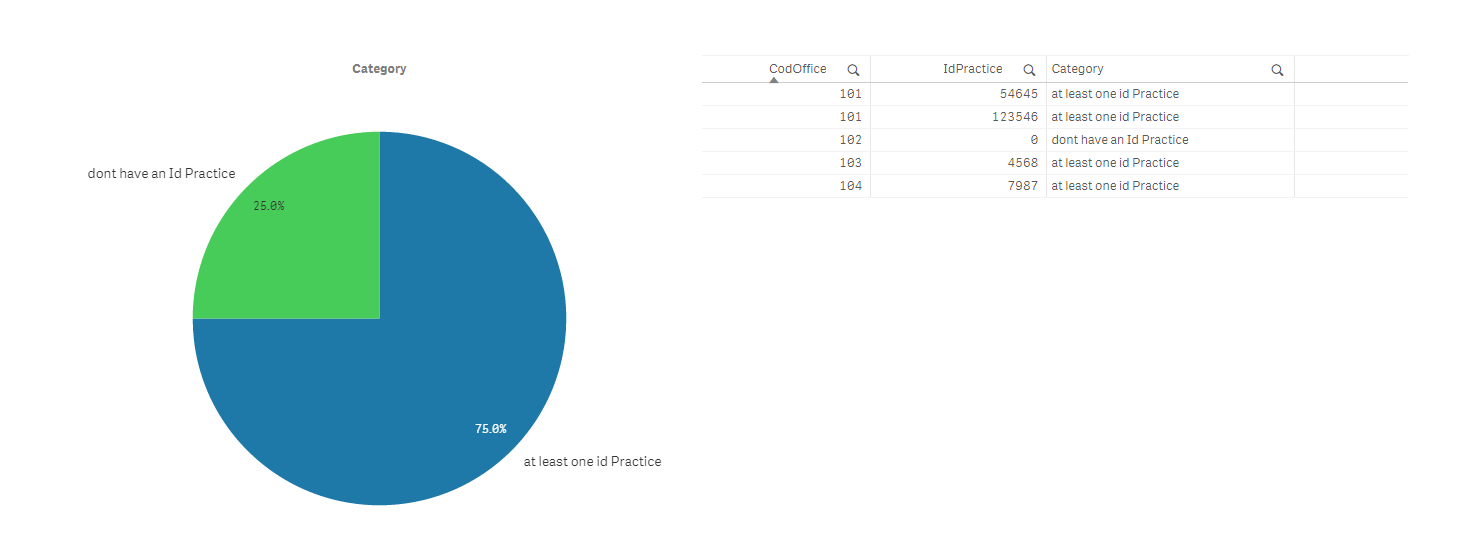
2. then you can count the CodOffice: count(distinct CodOffice)
3. finally you can built the pie chart and use it as a filter
Please see attached images
Regards,
1,721 Views