Unlock a world of possibilities! Login now and discover the exclusive benefits awaiting you.
Product Innovation
By reading the Product Innovation blog, you will learn about what's new across all of the products in our growing Qlik product portfolio.
Support Updates
The Support Updates blog delivers important and useful Qlik Support information about end-of-product support, new service releases, and general support topics.
Qlik Academic Program
This blog was created for professors and students using Qlik within academia.
Community News
Hear it from your Community Managers! The Community News blog provides updates about the Qlik Community Platform and other news and important announcements.
Qlik Digest
The Qlik Digest is your essential monthly low-down of the need-to-know product updates, events, and resources from Qlik.
Qlik Learning
The Qlik Learning blog offers information about the latest updates to our courses and programs, as well as insights from the Qlik Learning team.
Recent Blog Posts
-
【6/7(水)14:00 - 15:00 開催】Web セミナー:Qlik と Dr.Sum で、散在するデータの再活用を促進!
データドリブンな組織づくりを推進しようと、データ活用を推し進める企業が増えてきました。社内に散っている多種多様なデータの統合や、BI ツールを使った可視化・分析を進めているものの、まだ部分的、あるいは分断的に導入されているケースが多く見受けられます。本質的なデータ活用に向けては、これらが一気通貫で実現され、誰でもデータにアクセスし分析できること、そしてデータをもとに行動できる状態にあることが必要不可欠です。 本セミナーでは、基幹システムなどさまざまなデータソースからほぼリアルタイムでデータを取得できる Qlik のデータ統合製品「Qlik Replicate」と、プログラミングを必要とせずビジネスユーザーが直感的に使える BI ツール「Qlik Sense」と、データ分析基盤として国内シェア No.1* を誇るウイングアーク 1stの「Dr.Sum」の連携によって、データ活用の用途の幅をどのように広げていくのかをご紹介いたします。*出典:ITR「 DBMS/BI 市場 2021」データ分... Show Moreデータドリブンな組織づくりを推進しようと、データ活用を推し進める企業が増えてきました。社内に散っている多種多様なデータの統合や、BI ツールを使った可視化・分析を進めているものの、まだ部分的、あるいは分断的に導入されているケースが多く見受けられます。本質的なデータ活用に向けては、これらが一気通貫で実現され、誰でもデータにアクセスし分析できること、そしてデータをもとに行動できる状態にあることが必要不可欠です。
本セミナーでは、基幹システムなどさまざまなデータソースからほぼリアルタイムでデータを取得できる Qlik のデータ統合製品「Qlik Replicate」と、プログラミングを必要とせずビジネスユーザーが直感的に使える BI ツール「Qlik Sense」と、データ分析基盤として国内シェア No.1* を誇るウイングアーク 1stの「Dr.Sum」の連携によって、データ活用の用途の幅をどのように広げていくのかをご紹介いたします。
*出典:ITR「 DBMS/BI 市場 2021」データ分析/レポーティング市場:ベンター別売上金額推移およびシェア詳細を見る
【開催概要】
日時:2023年 6月 7日(水)14:00 - 15:00
会場:オンライン
参加費:無料 -
【7/7(金)14:00 - 17:00 開催】共催セミナー:データ分析の新時代を切り拓く
※2023年 6月 2日(金)開催予定でしたが、悪天候のため、延期となりました。 本イベントは、データ分析と AI 技術に関心のあるビジネスリーダーや分析担当者を対象とし、最先端のテクノロジーを活用して、データドリブンなビジネスの成功を実現する方法や、ビジネスにおけるデータ分析と AI 技術が果たす役割について学ぶことができます。 Snowflake、Qlik、DataRobot の 3 社から、それぞれの企業が提供するソリューションの概要や、それらを組み合わせてどのようにデータドリブンなビジネスの成功を支援するかについてご説明します。Snowflake は、クラウドベースのデータウェアハウスであり、高速で柔軟なデータ処理を提供します。Qlik は、分析のためのデータ基盤を構築するデータ統合と、データ可視化・分析のためのユーザーフレンドリーなインターフェースを備えたビジネスインテリジェンスを提供します。DataRobot は、自動化された機械学習プラットフォームであり、モデルの構築、トレ... Show More※2023年 6月 2日(金)開催予定でしたが、悪天候のため、延期となりました。
本イベントは、データ分析と AI 技術に関心のあるビジネスリーダーや分析担当者を対象とし、最先端のテクノロジーを活用して、データドリブンなビジネスの成功を実現する方法や、ビジネスにおけるデータ分析と AI 技術が果たす役割について学ぶことができます。
Snowflake、Qlik、DataRobot の 3 社から、それぞれの企業が提供するソリューションの概要や、それらを組み合わせてどのようにデータドリブンなビジネスの成功を支援するかについてご説明します。Snowflake は、クラウドベースのデータウェアハウスであり、高速で柔軟なデータ処理を提供します。Qlik は、分析のためのデータ基盤を構築するデータ統合と、データ可視化・分析のためのユーザーフレンドリーなインターフェースを備えたビジネスインテリジェンスを提供します。DataRobot は、自動化された機械学習プラットフォームであり、モデルの構築、トレーニング、評価を簡単かつ迅速に行うことができます。
アシストは、参加者の方が自社のビジネスに適した戦略やツールを見つけ、競争優位性を獲得するためにデータドリブンなアプローチを採用することを支援いたします。
詳細を見る
【開催概要】
日時:2023年 7月 7日(金)14:00 – 17:00
会場:株式会社アシスト 西日本支社会議室
大阪市北区大深町4-20 グランフロント大阪タワー A 13F
参加費:無料 -
Rugby World Cup Japan 2019: stats and analytics
The Rugby World Cup has officially started today with the host country Japan beating Russia.
-
Qlik's Fully Integrated AI and ML Capabilities - Today and the Path Forward (tun...
Qlik is delivering Deeper insights and data-driven decisions for all . We are kicking off a video series focused on our strategy, capabilities, and direction for AI and ML. Over the next several weeks you’ll learn about our unique approach to AI and ML, our broad range of capabilities for Augmented Analytics in Qlik Sense, AutoML for Predictive Analytics, and Data Science Integration, and get a look at our future direction and what’s coming n... Show MoreQlik is delivering Deeper insights and data-driven decisions for all . We are kicking off a video series focused on our strategy, capabilities, and direction for AI and ML. Over the next several weeks you’ll learn about our unique approach to AI and ML, our broad range of capabilities for Augmented Analytics in Qlik Sense, AutoML for Predictive Analytics, and Data Science Integration, and get a look at our future direction and what’s coming next. (Part 1)
-
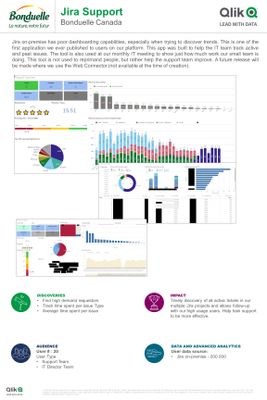
Bonduelle - Jira Support
Jira on-premise has poor dashboarding capabilities, especially when trying to discover trends. This is one of the first application we ever published to users on our platform. This app was built to help the IT team track active and past issues. The tool is also used at our monthly IT meeting to show just how much work our small team is doing.This tool is not used to reprimand people, but rather help the support team improve. A future release will... Show MoreJira on-premise has poor dashboarding capabilities, especially when trying to discover trends. This is one of the first application we ever published to users on our platform. This app was built to help the IT team track active and past issues. The tool is also used at our monthly IT meeting to show just how much work our small team is doing.
This tool is not used to reprimand people, but rather help the support team improve. A future release will be made where we use the Web Connector (not available at the time of creation).
-
Digital Accounting students get to grips with Qlik
The Academic Program had a busy Q1 this year delivering presentations and workshops to some of our longest standing members. -
Qlik | Talend:未来が今ここに(Qlik Blog 翻訳)
Qlik の CEO として、市場、戦略的ビジョン、そして世界中のお客様にもたらす価値について、これほど興奮したことはありません。 -
Expand your Qlik Data Integration knowledge
Choose from over 50 Qlik Data Integration self-paced learning modules in the Qlik Continuous Classroom. From Qlik Replicate Troubleshooting to Qlik Compose for Data warehouses, find the course to suit you.
-
Qlik Sense February 2023 Client-Managed Release - Now Available!
Now you can take advantage of features previously released Qlik Cloud, now available in client-managed. Our newest release of Qlik Sense includes expanded Augmented Analytics capabilities, new visualizations, and added connectivity. -
Filter Pane Customization
There are now many new ways a filter pane can be customized to change its appearance and/or functionality. In this blog, I will cover the new customizations available. Let's start with the new look of the filter pane properties panel (shown below). Now when the field or master item is selected in the properties panel, an additional properties panel is provided with further appearance and functionality options. There is now a “Show title” checkbo... Show MoreThere are now many new ways a filter pane can be customized to change its appearance and/or functionality. In this blog, I will cover the new customizations available. Let's start with the new look of the filter pane properties panel (shown below). Now when the field or master item is selected in the properties panel, an additional properties panel is provided with further appearance and functionality options.
There is now a “Show title” checkbox that can be used by app developers to show or hide the title of the filter pane. App developers can indicate if they want search capabilities on or off in a filter pane by toggling the Search option. By default, the search mode for a filter pane is normal, but now it can be set to Wildcard mode which adds asterisks before and after the search text like this:
This example wildcard search will search for any text with “wear” in it.
In the presentation section of the properties panel, is where app developers can customize how the filter pane will look. By default, the text alignment is set to Auto, but it can also be set to left, center or right. There are checkboxes for the following options: Compact view, Checkbox mode and Histogram.
The Compact view option reduces the space between dimension values, fitting more items in less space. In the image below, the second filter pane has the Compact view option checked. Notice that there is less space between the list items, making the filter pane smaller than the default filter pane on the far left. This can be helpful if space is an issue on your sheet. The Checkbox mode (see third filter pane) will add a checkbox to the left of the list items and the checkbox is what is used to make selections. The Histogram option (fourth filter pane) displays bars under each list items to indicate the frequency of the item in the data – it is like a visual representation of the frequency. Each of these options can be used independently or in combination with one another. Below is an example of each and all three together.
The last of the new customization options that can be found in the properties pane is how to show the data – either single column or grid.
Here is a simple example using the Year dimension. The filter pane on the left is showing the filter as a grid while the filter pane on the right is showing a single column.
Here is another example of the grid option when there are more values.
When displaying the values in a grid, the app developer is presented with the option to set the order and the maximum number of columns. In the example above the values are ordered by row, so you read them from left to right versus top to bottom. The Max visible columns can be manually set (custom) or can be set to auto.
These new filter pane customization options provide the app developer with more flexibility in how they would like to present filter panes on a sheet. Check out Qlik Help for a video on creating a filter pane as well as additional helpful information. Also take a look at Michael Tarallo’s SaaS in 60 video here for this and other new features in Qlik Sense SaaS.
Thanks,
Jennell
-
Excluding values in Set Analysis
The Set Analysis is a commonly used tool when creating static or dynamic filters inside aggregations in Qlik Sense or QlikView. But sometimes you need the opposite to selecting – you need to exclude values. How can this be done?
-
Qlik Cloud Government releases major update with Data Integration, Automations, ...
Qlik Cloud Government has expanded its product portfolio and can now enable end to end solutions across both Data Integration and Analytics with the inclusion of Application Automation, Direct Query, Data Gateway, and more. Learn More at the QlikWorld Public Sector Tour! Register Here -
Qlik Data Integration Client-Managed Releases in May 2023
As spring is now firmly in the air, our Qlik Data Integration Client-Managed portfolio continues to bloom with several new releases. -
Qlik Digest - May 2023
Welcome to the May Qlik Digest! If you didn’t make it to Vegas for QlikWorld last month, you can now relive the action on-demand. Catch the product keynote and guest keynote from John Volanthen, the cave diver who played a key role in the Thailand cave rescue saving 13 children. -

-
Continue your learning with Qlik Continuous Classroom!
Missed QlikWorld’s Hands-On Workshops? Or Want to Learn More about the Workshop Topics? Qlik Continuous Classroom Has You Covered Start learning now!
-
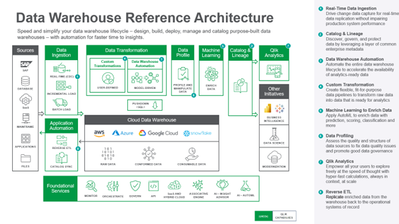
Qlik Use Case Reference Architecture - #1: Data Warehouse Reference Architecture
Meet or exceed the demands for analytics-ready data marts that enable data-driven insights at the speed of change.Qlik Data Integration (QDI) delivers on the promise of agile data warehousing with automation that allows users to quickly design, build, deploy, manage and catalog purpose-built data warehouses (especially cloud-based) faster than traditional solutions. Consequently, data engineers can meet or exceed the demands for analytics-ready d... Show MoreMeet or exceed the demands for analytics-ready data marts that enable data-driven insights at the speed of change.
Qlik Data Integration (QDI) delivers on the promise of agile data warehousing with automation that allows users to quickly design, build, deploy, manage and catalog purpose-built data warehouses (especially cloud-based) faster than traditional solutions. Consequently, data engineers can meet or exceed the demands for analytics-ready data marts that enable data-driven insights at the speed of change.
-
New Qlik Application Automation and AutoML Courses
New Qlik AutoML and Application Automation Courses are now avalible within Qlik Continuous Classroom!
-
Continue Your Learning Post-QlikWorld with Qlik Continuous Classroom!
Missed QlikWorld’s Hands-On Workshops? Or Want to Learn More about the Workshop Topics? Qlik Continuous Classroom Has You Covered! Below are resources for Qlik’s Hands-On Workshops at QlikWorld. Stay fresh or learn more about the Workshop’s topics with Qlik Continuous Classroom – many FREE self-paced courses! Start learning now! Qlik Cloud Data Integration Hands-On Workshop: FREE course: Using Qlik Cloud Data Integration to Onboard and Transfo... Show MoreMissed QlikWorld’s Hands-On Workshops? Or Want to Learn More about the Workshop Topics? Qlik Continuous Classroom Has You Covered!
Below are resources for Qlik’s Hands-On Workshops at QlikWorld. Stay fresh or learn more about the Workshop’s topics with Qlik Continuous Classroom – many FREE self-paced courses!
Qlik Cloud Data Integration Hands-On Workshop:
FREE course: Using Qlik Cloud Data Integration to Onboard and Transform DataMigrating to Qlik Cloud Hands-On Workshop:
FREE course: Migrating to Qlik Cloud Learning PlanAccessing Data for Analytics Hands-On Workshop - Optimizing Cost vs. Performance vs. Business Requirements:
Introduction to On-demand App Generation and Introduction to Dynamic Views [Subscription required]Qlik Cloud Embedded Analytics Hands-On Workshop:
Course: Styling an App (qlik.com) [Subscription required]Introduction to Qlik AutoML Hands-On Workshop:
FREE courses: Introduction to Qlik AutoML, Qlik AutoML Multi Classification Model with a Link to all Qlik AutoML coursesAfter-hours Workshop: Amazing Visualizations:
FREE courses: Using Insights to Create Visualizations and Using the Default Sheet Editing View in the Cloud -
Alternate States for Comparative Analysis in Qlik Sense
When analyzing data with Qlik Sense, you might have come across the need to compare two sets of selections side by side. This is where the Alternate States feature come into play, allowing you to create different sets of selections and compare them in the same dashboard. In this blog post, we'll walk through the process of performing comparative analysis using alternate states in Qlik Sense including how to create it, apply it, and we’ll dive int... Show MoreWhen analyzing data with Qlik Sense, you might have come across the need to compare two sets of selections side by side. This is where the Alternate States feature come into play, allowing you to create different sets of selections and compare them in the same dashboard. In this blog post, we'll walk through the process of performing comparative analysis using alternate states in Qlik Sense including how to create it, apply it, and we’ll dive into how we can synchronize selections between the default state and alternate states.
What are Alternate States?
Alternate states in Qlik Sense can be thought of as multiple windows looking into the same app data model, allowing users to perform comparative analysis without losing or overriding other selections. Each state represents a unique perspective (For example, a Sales perspective, Operations, or Finance view) on the data, and these different windows or "states" can coexist within the same app without interfering with one another.
The normal operation of Qlik Sense involves a default state that affects the entire app when selections are made since every object in each sheet inherits from this state. However, this inheritance can be broken by creating new states for either sheets or individual objects, allowing them to exist independently and enabling side-by-side comparisons of charts. In this way, selections on different objects on the same sheet can co-exist without interfering with one another. This allows for having side-by-side comparison of charts.
Setting up the Alternate States
Let’s create two states for our example:
- Click on “Master Items” then ‘Alternate States”
- Select “Create new”
- Enter “State A” as the name.
Keep in mind that there are some naming limitations:
- Do not use $, 0, or 1 as a state name.
- Do not use a state name starting with $ or $_ followed by a number (for example $3).
- Do not use a state name already used as a bookmark name.
- Repeat the same for the second state and name it “State B”
- Add 2 filter panes with the “Country” field and 3 bar charts
- For each filter pane, go to Appearance > Alternate Sates and select State A and State B respectively.
- In the 2 bar charts, add “Country” as a dimension and “count of distinct Orders” as a measure.
Notice that now, if you try and make a Selection in either filter pane, nothing will happen to the Bar charts, that is because the selections are made to the newly created Alternate States whereas the bar charts are still in the default state.
Applying Alternate States
In order to make the selections on the Alternate states affect the visualization objects, we need to link them to these alternate states. We can do that in a variety of ways:
1- You can drag the newly created state from the left sidebar onto the visualization
2- You can go to the properties of the visualization, and under Appearance > Alternate states, choose the appropriate state from the dropdown (similar to what we did on the filter panes).
3- You can use Set Analysis to add the alternate state to the measure. Let’s use the following expression in our bar charts:
Count({[State A]} distinct orderID)
Count({[State B]} distinct orderID)
Bonus: Dynamic title for the Bar Charts.
If you want the title of the bar chart to reflect the selections of the respective alternate state, you can use the following expression:
='# of Orders '&GetCurrentSelections(chr(13)&chr(10), ': ', ',', 9, 'State A')
This will get the current selections in State A and comma separate them. Repeat this for State B.
Using Set Operators with Alternate States
It’s possible to use Set Operators (+, *, -, /) with states, meaning that we can do intersections, unions, exceptions etc... For example:
- Count({$ + [State A]} distinct orderID) -> will count the distinct orders in the union of the “Default” state and the alternate state “State A”.
- Count({1 - [State A]} distinct orderID) -> will count the distinct orders NOT in “State A”
- Count({[State A] * [State B]} distinct orderID) -> will count the distinct orders that are both in the intersection of ”State A“ and “State B”
Keep in mind that you should be cautions when using set operators in this manner. In some situations the result will not be what is expected. This is because the selections in a given state generate a set of data that may not be fully compatible with the set(s) it is being combined with. This is especially true as the complexity of the data model increases.
Synchronizing Selections between the Default state and Alternate States
When doing comparative analysis, you might run into a case where for instance you have 2 alternate states A and B, as well as the Default state.
Let’s say that we have 3 filter panes based on the field “Country” that have states A, B, and Default. In addition to that, we have 2 more filter panes with fields “Year” and “Month” that only have state Default.
If we’re only comparing Countries, we would be fine to make selections in all 3 “Country” filter panes to compare.
However, if we make a selection in either “Year” or “Month” filter panes which are only in the Default state, we can no longer see a clear comparison. So how can we solve that?
It’s simple, we can tweak the expressions in our 2 “alternate state”-bound measures to the following:
Count({[State A]<[orderDate.autoCalendar.Year] = $::[orderDate.autoCalendar.Year], [orderDate.autoCalendar.Month] = $::[orderDate.autoCalendar.Month]>} distinct orderID)

Count({[State B]<[orderDate.autoCalendar.Year] = $::[orderDate.autoCalendar.Year], [orderDate.autoCalendar.Month] = $::[orderDate.autoCalendar.Month]>} distinct orderID)
Notice that we have added the following set analysis syntax for both "Year" and "Month":
[orderDate.autoCalendar.Year] = $::[orderDate.autoCalendar.Year]
This means that we can keep selections for "Year" and "Month" consistent between states because when we select “Year” and “Month” in the Default states, these selections will be automatically applied to our Alternate States!
Conclusion
Comparative analysis is an essential tool for data analysis. Using alternate states in Qlik Sense makes it possible to compare two different sets of selections side by side. You can also go beyond the basics and leverage the power of Set Analysis to include Set operators or to automatically sync fields across states.
Attached is a QVF that has the example we went through!
Thanks for reading.