Unlock a world of possibilities! Login now and discover the exclusive benefits awaiting you.
This space offers a variety of blogs, all written by Qlik employees. Product and non product related.
Product Innovation
By reading the Product Innovation blog, you will learn about what's new across all of the products in our growing Qlik product portfolio.
Support Updates
The Support Updates blog delivers important and useful Qlik Support information about end-of-product support, new service releases, and general support topics.
Qlik Academic Program
This blog was created for professors and students using Qlik within academia.
Community News
Hear it from your Community Managers! The Community News blog provides updates about the Qlik Community Platform and other news and important announcements.
Qlik Digest
The Qlik Digest is your essential monthly low-down of the need-to-know product updates, events, and resources from Qlik.
Qlik Education
The Qlik Education blog provides information about the latest updates of our courses and programs with the Qlik Education team.
Recent Blog Posts
-
Qlik February 2021 Release Now Available!
Hello Qlik Users!The first release of 2021 is now available: Qlik February 2021!February 2021 releases are available for the following Qlik products:Qlik Sense Enterprise for WindowsQlik Sense SaaS (already pushed out!)Qlik DataTransferQlik GeoAnalyticsQlik NPrintingQlik AlertingQlik Catalog You can find the installation package for each product on the Qlik Downloads page along with the corresponding Release Notes.Please follow best practices whe... Show MoreHello Qlik Users!
The first release of 2021 is now available: Qlik February 2021!
February 2021 releases are available for the following Qlik products:
- Qlik Sense Enterprise for Windows
- Qlik Sense SaaS (already pushed out!)
- Qlik DataTransfer
- Qlik GeoAnalytics
- Qlik NPrinting
- Qlik Alerting
- Qlik Catalog
You can find the installation package for each product on the Qlik Downloads page along with the corresponding Release Notes.
Please follow best practices when upgrading any of these platforms – read the release notes, back up your environment and test the upgrade in a QA environment.
Want to see what’s available in the releases? Head on over to the Product Innovation Blog! There is a summary video as well as a feature demonstration video! Here is the actual link to the February 2021 release blog for your convenience:
Personalize, Narrate, Reuse: Something for Everyone in Qlik’s February Product release
You might notice at the end of the blog, that there is a change to the release cadence for client-managed platforms. Releases will now be quarterly and occur during the second month of the quarter. Look forward to the next release in May (there will not be an April or June release)!
Qlik Sense SaaS will have a continuous release cadence with new features added throughout the year. You will be updated within the product as these new features are released. There is also the What’s new section on Qlik Help.
So, what feature are you looking forward to the most in the February 2021 release? Let us know in the comments! Also let us know if you have any questions or how else we can assist you with ramping up on the newest releases.
Be sure to subscribe to the Qlik Support Updates Blog by clicking the green Subscribe button to stay up-to-date with the latest releases. Please give this post a like if you found it helpful!
Thank you for choosing Qlik!
Kind Regards,
Qlik Global Support
-
24 hours until the next Qlik Academic Program webinar
If you are just discovering the Qlik Academic Program and would like to get to know more about us, make sure you sign up for our next introductory webinar happening tomorrow, 16 February at 2pm GMT. -
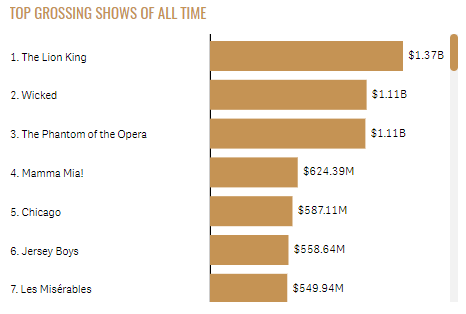
Rank Function
Over the years, I have seen the Rank function used in various expressions. Recently, I was working on a Broadway Shows project where we wanted to show the rank in a bar chart before the label adding a numeric indicator of how a show ranked. You can see what I am referring to in the bar charts used in the Broadway app. The bar chart below is an example of one of the charts. We added the rank before the show name on the y-axis label.In this blo... Show MoreOver the years, I have seen the Rank function used in various expressions. Recently, I was working on a Broadway Shows project where we wanted to show the rank in a bar chart before the label adding a numeric indicator of how a show ranked. You can see what I am referring to in the bar charts used in the Broadway app. The bar chart below is an example of one of the charts. We added the rank before the show name on the y-axis label.
In this blog, I will discuss how the Rank arguments can be used to change how the rank is presented. To do so, I will use a simplified data set to illustrate how the rank can be displayed. Let’s start by defining the Rank function. The Rank function is a chart function and is defined in Qlik Sense Help as:
“Rank() evaluates the rows of the chart in the expression, and for each row, displays the relative position of the value of the dimension evaluated in the expression. When evaluating the expression, the function compares the result with the result of the other rows containing the current column segment and returns the ranking of the current row within the segment.
For charts other than tables, the current column segment is defined as it appears in the chart's straight table equivalent.
Syntax:
Rank([TOTAL] expr[, mode[, fmt]])”
Originally, I used the Rank function without any arguments. This will rank the products by their sales and display it before the product label.

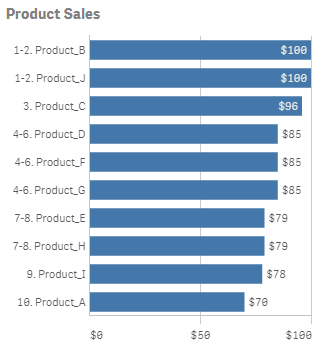
By default, with no arguments for mode and fmt, the Rank function will show the lowest and highest value displayed like a range as seen in the chart above. But what if you want to show a single number for the rank where Product_B and Product_J would show 1 as the rank for both projects since they both tied for first place. This can be accomplished by using the mode and fmt arguments. Mode can take values 0 – 4 and controls which rank is shown for each row for example show the lowest rank, the average rank or the highest rank. The fmt argument takes values 0 – 2 and controls how and where the rank is displayed. You can find the detailed description for each setting in Qlik Sense Help.
For the Broadway app, I set the mode to 4 and the fmt to 1. If I do this with this data set, I will get a chart like this:


The mode argument is 4. This will show the lowest rank on the first row, then increment by one for each row. The fmt argument is 1 and this will show the low value on all rows. When there is a tie, only the lowest rank will be displayed on the respective rows.
There are not always ties when using the Rank function but when there are, the Rank function provides options for how to handle the display of the rank. This was something I never had a need for until now but I found it to be very valuable so I thought I would share what I have learned. The next time you use the Rank function, try out the various arguments to find the display that works best for your app.
Thanks,
Jennell
-
Talk to Experts Tuesday – Qlik GeoAnalytics/GeoOperations Recording & FAQ availa...
Hello Qlik Users!The FAQ can be found in the Knowledge Base: Talk to Experts Tuesday – Qlik GeoAnalytics/GeoOperations FAQ.The Talk to Experts Tuesday page under ‘Past Events’, is home for all of previous recordings and transcripts, including this Qlik GeoAnalytics/GeoOperations session.Please join us for our next session on February 23rd where we will be answering questions on Qlik Compose!For more Qlik events and webinars, please check out the ... Show MoreHello Qlik Users!
The FAQ can be found in the Knowledge Base: Talk to Experts Tuesday – Qlik GeoAnalytics/GeoOperations FAQ.
The Talk to Experts Tuesday page under ‘Past Events’, is home for all of previous recordings and transcripts, including this Qlik GeoAnalytics/GeoOperations session.
Please join us for our next session on February 23rd where we will be answering questions on Qlik Compose!
For more Qlik events and webinars, please check out the Qlik Events page on the Qlik Community.
Thank you again for joining the session and for, of course, choosing Qlik!
Kind regards,
Qlik Digital Support
-
Mashup Editor - Create a Bootstrap Drop Down selection menu
In many of my webpages that I've created using the Capabilities API, I had to create a custom menu and I always used Bootstrap's Dropdown component. In this tutorial I will show how to do the same.From the Mashup Editor, create a new project and give it a name, using "Grid Mashup Template". this will include bootstrap for you..Select the app "Helpdesk Management.qvf".From the right hand side, create a list and select "Department" from the Dimensi... Show MoreIn many of my webpages that I've created using the Capabilities API, I had to create a custom menu and I always used Bootstrap's Dropdown component. In this tutorial I will show how to do the same.
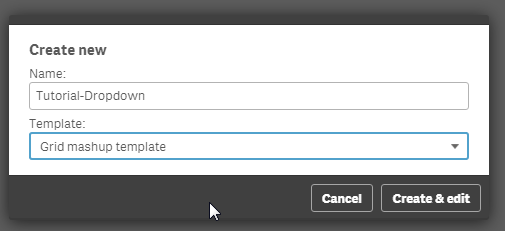
From the Mashup Editor, create a new project and give it a name, using "Grid Mashup Template". this will include bootstrap for you.
.
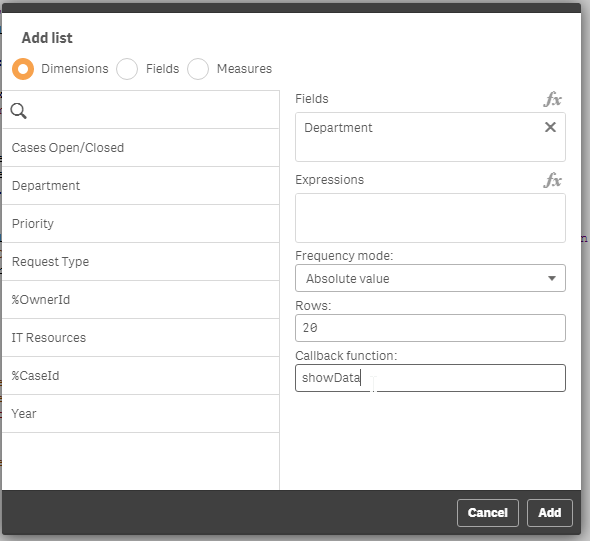
Select the app "Helpdesk Management.qvf".
From the right hand side, create a list and select "Department" from the Dimensions. Make sure you add a callback function, since that is where we will put our code. Here, I named it showData.
Now, lets go to the html template and add the dropdown code.
In the div that has the id="QV01", add the following:
  <div class="col-sm-4 qvplaceholder" id="QV01">
   <div class="dropdown">
  <button class="btn btn-default dropdown-toggle" type="button" id="dropdownMenu1" data-toggle="dropdown" aria-haspopup="true" aria-expanded="true">
   Select Department
   <span class="caret"></span>
  </button>
  <ul class="dropdown-menu" aria-labelledby="dropdownMenu1">
  </ul>
   </div>
  </div>
In your javascript code, you will see a callback function created.
//callbacks -- inserted here --
function showData(reply, app){}
The reply has all of the data from the Dimension so we can create the list elements in the drop down. So, let's populate the drop down list elements.
function showData(reply, app){
     $('#QV01 .dropdown ul').empty()
     $.each(reply.qListObject.qDataPages[0].qMatrix, function(key, value) {
          if (typeof value[0].qText !== 'undefined') {
               $('#QV01 .dropdown ul').append('<li><a data-select="'+ value[0].qText+'" href="#">'+ value[0].qText+'</a></li>');
          }
     });
}
Notice that we empty the list first, otherwise every time we make a selection, the same elements will be added in the drop down.
Now, we have to add a jQuery on click event that will trigger the selection and change the button value.
$('body').on( "click", "[data-select]", function() {
     var value = $(this).data('select');
     app.field('Case Owner Group').selectValues([value], false, false);
     $('#QV01 .dropdown button').html(value + ' <span class="caret"></span>');
  });
The selection drop down is ready. now lets add some more graphs to make it more interesting when we select a department. I added 'Open & resolved cases over time', the KPI 'High priority Cases' and 'Case Details'. So the final page should look like this:
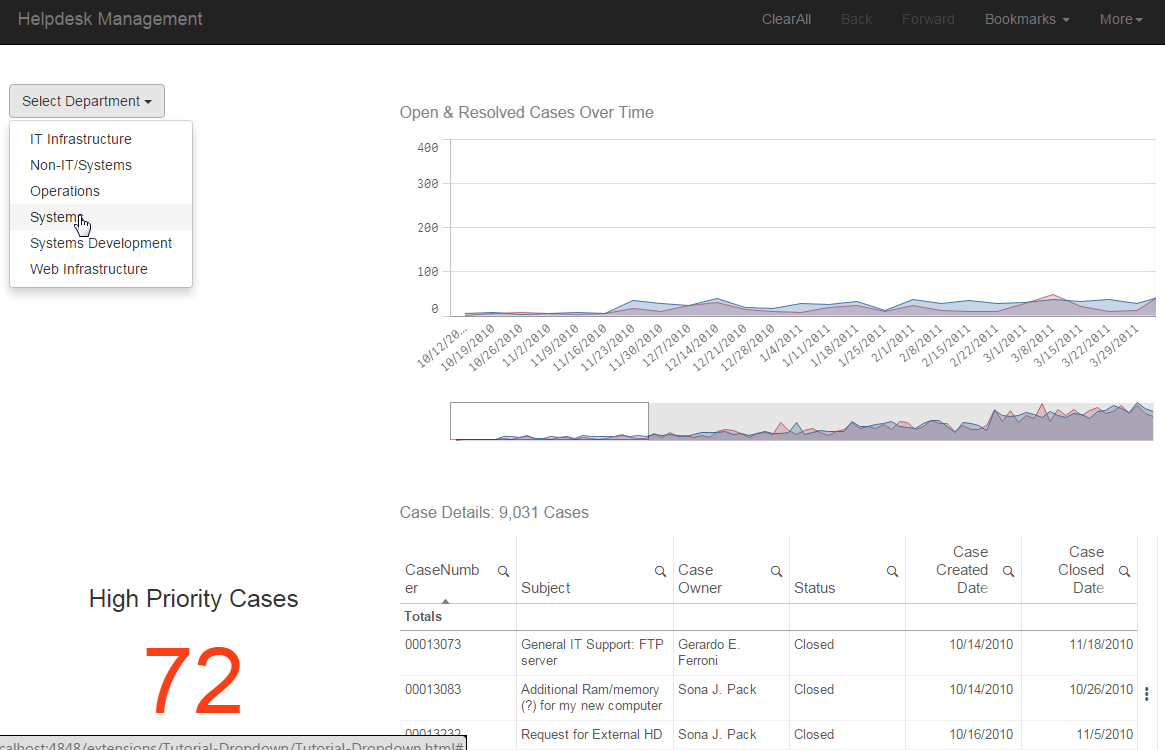
Last, we must set the button to the original state after the user clicks on the "Clear All". We just add the following line in the code.
case 'clearAll':
     app.clearAll();
     $('#QV01 .dropdown button').html('Select Department <span class="caret"></span>');
     break;
-
Qlik Sense SaaS – Scheduled reloads issue in US
Hello Qlik Users,Our cloud team is currently investing an issue with scheduled reloads happening in the US region.To stay up to date on the issue, please click ‘Subscribe’ on the Qlik Status Page, enter in your email address, then confirm the subscription.This blog post will be updated as more information comes in as well.Kind regards,Qlik Global Support Update: This issue was resolved Feb 11, 2021 at 9:32am EST -
COVID19 - Vaccination Italy
Based on the Open data from Public Health Goverment Service, progress in vaccination is shown in two dashboads.Differently from the official infographic (https://www.governo.it/it/cscovid19/report-vaccini/) in the QlikView app you can navigate data widely and more in depth.Open data are drawn from Github via rest connector (https://github.com/italia/covid19-opendata-vaccini/) dash1dash2
-
Qlik Patch Wednesday – New releases available now!
Hello Qlik Users,We have two Qlik Sense patches available today. You can find the following patches on the Qlik download site:Qlik Sense Patch November 2020 Patch 5Release NotesResolved DefectsFebruary 2020 Patch 11Release NotesResolved Defects**Document is not available yetYou will also notice there is a link to an article that lists the resolved defects for the corresponding patch. Moving forward, we will provide this information in an article... Show MoreHello Qlik Users,
We have two Qlik Sense patches available today. You can find the following patches on the Qlik download site:
Qlik Sense Patch
November 2020 Patch 5
February 2020 Patch 11
Resolved Defects*
*Document is not available yet
You will also notice there is a link to an article that lists the resolved defects for the corresponding patch. Moving forward, we will provide this information in an article to make it easier to search for resolved issues in our Knowledge Base.
Each Qlik Sense patch has a few fixes so please follow best practices:
- Read the release notes
- Back up your Qlik Sense environment
- Test the patch in a QA environment
For more guidance on upgrades, see the Qlik Sense Upgrade guide. This guide was put together by the Qlik Digital Support team and offers step-by-step instructions, pictures and troubleshooting tips.
Be sure to subscribe to the Qlik Support Updates Blog by clicking the green Subscribe button to stay up-to-date with the latest releases. Please give this post a like if you found it helpful! Also, please let us know if you have any questions or what you think about the new articles that list the defects.
Thank you for choosing Qlik!
Kind Regards,
Qlik Global Support
-
Quotes in Set Analysis
Today, the Qlik engine has some bugs in the area of a search and a subsequent select. These affect both interactive searches and searches in Set Analysis expressions. We are working on fixing them. However, one of these coming bug fixes may cause some backward incompatibility. This post explains what the bug fix will mean, and what you can do to avoid future problems.
-
Level up your Qlik skills with instructor-led training
Whether you are a beginner, or an advanced developer save time learning from our expert instructors. We have the perfect course just for you. Beginner:Create Visualizations with Qlik SenseData Modeling for Qlik Sense Advanced:Advanced Scripting CapabilitiesAdvances Calculations and ExpressionsAdvanced Topics in Design and Development System Administrator:Deploy and Administer Qlik Sense Web Developer:Embed Analytics with Qlik Sense APIs Additiona... Show MoreWhether you are a beginner, or an advanced developer save time learning from our expert instructors. We have the perfect course just for you.
Beginner:
Create Visualizations with Qlik Sense
Advanced:
Advanced Scripting Capabilities
Advances Calculations and Expressions
Advanced Topics in Design and Development
System Administrator:
Deploy and Administer Qlik Sense
Web Developer:
Embed Analytics with Qlik Sense APIs
Additional class schedules include Create Report with Qlik NPrinting, Qlik GeoAnalytics, QlikView courses and of course do not forget our Data Literacy and Data Analytics courses too!
-
Announcing our first ever class of Qlik Academic Program Professor Ambassadors!
The Qlik Academic Program is proud to announce our inaugural class of Professor Ambassadors. These are educators who champion the Qlik Academic Program at their universities and beyond, with a passion for preparing students for the data driven workplace. These individuals are some of our most active participants of the Qlik Academic Program who fully utilise the free software, training resources and qualifications that we provide to university st... Show MoreThe Qlik Academic Program is proud to announce our inaugural class of Professor Ambassadors. These are educators who champion the Qlik Academic Program at their universities and beyond, with a passion for preparing students for the data driven workplace. These individuals are some of our most active participants of the Qlik Academic Program who fully utilise the free software, training resources and qualifications that we provide to university students and educators. The members of our inaugural class are:
- Richard Wilkinson, Senior Lecturer in Computing, University of Worcester, United Kingdom
- Jerry Roek, Adjunct Faculty in Statistics and Business Analytics, Oakland University, Texas A&M - San Antonio, United States
- Javier Leon, Adjunct Professor in Business Intelligence and Analytics, Saint Joseph's University, United States
- Angelika Klidas, Lecturer in Data and Analytics, University of Applied Sciences Amsterdam, Netherlands
- Blerim Emruli, Senior Lecturer in Informatics, Lund University, Sweden
- Sukanta Ghosh, Assistant Professor in Computer Applications, Lovely Professional University, India
- Josué Lima Romano, Research Professor in Economic and Social Sciences, Universidad de Congreso, Argentina
Meet the Qlik Academic Program Professor Ambassadors for 2021
We are thrilled to be recognising the efforts of these individuals to help the Qlik Academic Program to achieve its mission - to create a data literate world, one student at a time. Each ambassador has been selected through a self-nominated application process, where they were required to answer various questions covering their motivations for becoming an ambassador, and to evidence their passion for upskilling their students in analytics over the past 12 months. By way of thanks for their efforts our ambassadors will receive exclusive benefits such as webinars and discussion groups with Qlik leaders, opportunities to showcase their experience with the Qlik Academic Program and the chance to grow their network with other educators across various fields and geographies.
Throughout 2021 our ambassadors will continue their advocacy for the Qlik Academic Program and help us to reach even more students and educators with our free resources. Stay tuned over the coming months for more in-depth profiles on each of our ambassadors, and get to know who they are, what they teach and why they are so passionate about bridging the data literacy skills gap! Learn more about the program and how to apply for future classes.
-
Community Redesign - Phase 2
Community Members, I'd like to introduce you to our brand new Qlik Community! We hope you love it as much as we do! This article will tell you everything you need to know about what has changed. First, let me provide some backdrop: A month ago we kicked off our Community redesign efforts when we launched new banners sitewide and new promo cards addressing some of the inside components of our community. The design concept was born with the l... Show MoreCommunity Members, I'd like to introduce you to our brand new Qlik Community! We hope you love it as much as we do! This article will tell you everything you need to know about what has changed.
First, let me provide some backdrop:
A month ago we kicked off our Community redesign efforts when we launched new banners sitewide and new promo cards addressing some of the inside components of our community. The design concept was born with the launch of Qlik Gallery and was later streamlined into many Qlik Community 2020 social campaigns:
This is one example of a new banner image:
You can read about the all changes that deployed last month here.
Today, you will notice even more changes:
#1. A newly redesigned home page
Meant to deliver a brand new look and feel, more modern in design yet playful and fun! When we launched to our new platform over 2 years ago we were 58K members strong. Today, we have 115K+ members and growing every single day. It was time for a change! Recreating the home page banner was no easy feat as we wanted it to convey the beautiful and magnificent spirit of all of you! We'd like to thank Qlik's Creative and Brand services team for their creativity and dedication to this massive undertaking! ( it was 10+ revisions - no joke ).It's pretty amazing when you look at the change side-by-side:
On the new home page you will notice new imagery throughout and also a refreshed use of icons:
From Left to Right
(a) Discussion (b) Document (c) Support-Authored Knowledge Article (d) Idea#2. Brand New Top Level Navigation
We have completed our shift to a Top Level Navigation. YAHOO! There are multiple tiers to the navigation structure ranging from 1 to 4 tiers. The hamburger menu will remain for our mobile device and tablet users.example of 2 Tiers:
example of 3 Tiers:
example of hamburger menu, with newly created icons, for our phone and tablet users.
We have also updated the Top Level Utility Bar by improving placement of the icons, and while we were at it we aligned those icons to match what you see on Qlik.com.
To get to your community settings select the little green arrow that sits next to your avatar.
One of our favorite new additions is the "Ask a Question" button. Meant for members that need to get a question answered and fast - we made it easier for you to do just that. This will be especially useful for newbies to our community who haven't figured out how to navigate to specific forums. YES!
3. Improvements to Search
Incredibly excited to share with you that we now have Unified Search available to our members. Double YES!
Already in place today on our Qlik Support Portal, you will now have a consistent search experience across these two platforms. In case you prefer the old and familiar you can revert back to Classic Community Search at any time.
(and yes, we are discussing bringing Unified Search to other Qlik platforms as well - but I can't make any promises).On behalf of the Qlik Community Team we want to thank you for taking this journey with us and embracing change. To report any functional issues with the new design please go here --> https://community.qlik.com/t5/Getting-Started-and-How-To-s/January-2021-Redesign-Issue-Tracking-Post-Launch/ta-p/1772708.
We hope that you enjoy your new space. See you online!
Melissa and Sue
PS. What's coming next on Qlik Community:
- UI improvements for Blogs
- New forum for Application Automation
- Forum Consolidation - with focus on Qlik Sense and QlikView forums
- New Program for Community MVPs
- Top Secret new program. Stay tuned for the one thing I can share - the name - 'Qlik Greenway' !

-
Techspert Thursdays - Qlik Replicate with Db2 Purescale
Hi everyone,Want to stay a step ahead of important Qlik support issues? Then sign up for our monthly webinar series where you can get first-hand insights from our Qlik Support experts.The Support Techspert Thursday session from February looked at Configure & Recover Db2 Purescale as a Qlik Replicate Source Endpoint.But wait, what is it exactly?Support Techspert Thursdays is a free webinar to facilitate knowledge sharing held on a monthly basis, ... Show MoreHi everyone,
Want to stay a step ahead of important Qlik support issues? Then sign up for our monthly webinar series where you can get first-hand insights from our Qlik Support experts.The Support Techspert Thursday session from February looked at Configure & Recover Db2 Purescale as a Qlik Replicate Source Endpoint.
But wait, what is it exactly?
Support Techspert Thursdays is a free webinar to facilitate knowledge sharing held on a monthly basis, on the third Thursday of each month.
Hear directly from Qlik Techsperts on topics that are relevant to Customers and Partners today.In this session we will cover:
• Replicate Target vs Source
• How to setup Purscale end point
• How to recover
• Troubleshooting tipsClik on this link to see the presentation.

-
Exciting changes to Qlik Compose for Data Warehouses and Data Lakes in February ...
Hello Qlik Users,The February release of Qlik Compose for Data Warehouses and Data Lakes will bring about some changes that we wanted to make you all aware of in advance.Compose for Data Warehouses and Compose for Data Lakes will now be combined into one single product, Qlik Compose! One product installation will now give you the functionality of Compose for Data Warehouses and a completely revamped Data Lakes module.Here is the breakdown of what... Show MoreHello Qlik Users,
The February release of Qlik Compose for Data Warehouses and Data Lakes will bring about some changes that we wanted to make you all aware of in advance.
Compose for Data Warehouses and Compose for Data Lakes will now be combined into one single product, Qlik Compose! One product installation will now give you the functionality of Compose for Data Warehouses and a completely revamped Data Lakes module.
Here is the breakdown of what this means for existing customers that have one or both of the platforms.
Compose for Data Warehouses
As stated above, the product name will change from Compose for Data Warehouse to Qlik Compose. Due to the name change, please take note of some important changes and requirements:
- The upgrade procedure will require an uninstall and reinstall. Please review the release notes (when available) prior to upgrading for further details.
- There will be a new installation path by default.
- The Windows service name will be changed. Any procedures that referenced the old service name will need to be updated.
- The console URL will change. Any references/bookmarks will need to be updated.
You will also notice a change in the version numbering. With the newest release, the version number will go from Compose for Data Warehouses 7.0 (released in November 2020) to Qlik Compose 2021.2.
And the last change: While Qlik Compose will come with a new license, the existing license for Qlik Compose for Data Warehouse will still work. Please see the release notes (when available) for more information on licensing.
Compose for Data Lakes
Qlik Compose 2021.2 includes the next generation of the Qlik data lake creation functionality. This brand-new functionality is only available as a part of the upcoming Qlik Compose, it will not be provided on the previous version of Qlik Compose for Data Lakes.
New Qlik Compose functionality includes:
- Live Views to reduce latency and operational cost by merging the latest incoming changes on-read without running Qlik Compose tasks.
- A new approach for handling file-based lakes that is computationally efficient and provides continuous availability of consumable data
- Automated handling of Qlik Replicate table reloads for a seamless and integrated pipeline
The existing Qlik Compose for Data Lakes product will continue to receive updates for critical defects or security vulnerabilities. New functionality, however, will be provided as part of Qlik Compose and will not be provided on the previous version of the product.
Qlik Compose 2021.2 includes significant improvements over the first-generation functionality. In time, all existing customers should plan to migrate to Qlik Compose. Meanwhile, Qlik Compose can run side-by-side with Qlik Compose for Data Lakes on the same machine.
All current customers of Qlik Compose for Data Lakes are entitled to migrate to Qlik Compose at no extra charge. Migration utility to assist existing Qlik Compose for Data Lakes customers will be provided starting this summer. Please reach out to your Account Manager for more information on this process.
Qlik Compose has a new license but will accept existing licenses for Qlik Compose for Data Lakes.
Please let us know if you have any questions or feedback about these changes using the comments below. We are excited for these changes to offer one cohesive product.
Thank you for choosing Qlik!
Kind regards,
Qlik Digital Support
-
Featured Content Friday – Novel ideas for developing applications
Hello Qlik Users!Happy Featured Content Friday!Today we are featuring a Chief Solutions Architect that has been using Qlik since QlikView 8.2 (which was 13 years ago)!Michael of Axis Group!What does Michael say his favorite thing about Qlik is? Michael shared two posts from his blog with us:Simplifying time period analysis for Qlik self-service users*Please use this instead of Always One Selected or Pick/Match* We loved how he wanted to make work... Show MoreHello Qlik Users!
Happy Featured Content Friday!
Today we are featuring a Chief Solutions Architect that has been using Qlik since QlikView 8.2 (which was 13 years ago)!
Michael of Axis Group!
What does Michael say his favorite thing about Qlik is?
Michael shared two posts from his blog with us:
Simplifying time period analysis for Qlik self-service users*
Please use this instead of Always One Selected or Pick/Match*
We loved how he wanted to make working with time periods easier for end users and how he offered up an alternative solution to using Always one selected value or pick/match. Michael shares the pros and cons of the solution or the maintenance impact so you get a well-rounded picture of using these approaches. He also has other blogs on his page so take a look!
*The information in this post is provided as-is and to be used at own discretion. Depending on tool(s) used, customization(s), and/or other factors ongoing support may not be provided by Qlik Support.
Do you want to be spotlighted in a future post? See our Featured Content Friday Revamp for more information on submitting your dashboards, screenshots, ideas, videos, workarounds, how-to’s and more!
Thank you for being a part of the Qlik Community and for choosing Qlik!
Kind regards,
Qlik Digital Support
-
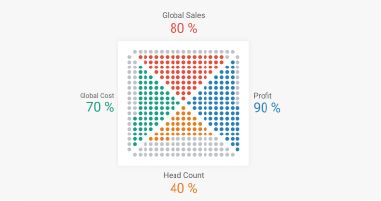
How to build a Dot Quadrant Chart in Qlik Sense
Our guest blogger Christophe Brault @christophebrault , will show you how to build a very different type of chart with Qlik Sense. A really smart addition to Qlik's wide chart library that illustrates how standard charts have more to offer when we look at them with the right eyes. Check out Christophe's website for more interesting examples with Qlik https://www.qreatic.fr/How to build a Quadrant Dot chart, step by stepHave you ever felt restrain... Show MoreOur guest blogger Christophe Brault @christophebrault , will show you how to build a very different type of chart with Qlik Sense. A really smart addition to Qlik's wide chart library that illustrates how standard charts have more to offer when we look at them with the right eyes. Check out Christophe's website for more interesting examples with Qlik https://www.qreatic.fr/
How to build a Quadrant Dot chart, step by step
Have you ever felt restrained with Qlik Sense graphic objects before? Personally, if I'm not careful, I feel like I'm doing the same Dashboard over and over again. Sometimes you want something different, surprising or striking. Those are the days when thinking out of the box gets especially important.
I found the Dot Quadrant chart online and I was curious about how could we achieve something like that in Qlik, so I tried.
In this article I will not discuss when or why to use this visualization, but I'll focus on a detailed guide on how to built it, and more generally, how to hijack basic graphics in Qlik.
Building our grid
First, we need to create a grid that contains all the dots that will make the chart. We will use a Scatter Plot Chart to create a 21 x 21 grid. Notice how we are generating a 21 X 21 grid instead of a 20 by 20, since we need to delimit each sector.
Generate every point in the script
TMP:
LOAD RECNO() AS X AUTOGENERATE 21;
JOIN LOAD RECNO() AS Y AUTOGENERATE 21;
Prepare your data
DATA :
LOAD X &'|'& Y AS POINT,
X+Y AS TOTAL,
X,Y
RESIDENT TMP;
DROP TABLE TMP;
Create the Dot Quadrant chart using a scatter chart and filling dimension with the field called Point, and X Y as measures. Set the Range for both to Max with 22 and there is your grid.
Create triangles
The first thing is to remove the points that separate our four sections. It’s easily done with X and Y. Use color "by Expression" in your chart to set the color to white so they disappear from view.
IF(X=Y OR X+Y=22, RGB(255,255,255))
To know what "triangle" each points belongs to you could use the conditions below
if(Total=22 or X=Y,'NONE',
 if(Total>=23 and Y>X,'TOP',
  if(Total<23 and Y>X,'LEFT',
   if(Total>=23 and Y<X,'RIGHT',
    if(Total<23 and Y<X,'BOTTOM')))))
Using those conditions you can generate a new field in your script called "POSITION" that will help you later on to target the right quarter of your Dot Quadrant Chart
Your loading script by now should look like the code below
TMP:
LOAD RECNO() AS X AUTOGENERATE 21;
JOIN
LOAD RECNO() AS Y AUTOGENERATE 21;

DATA:
// // DEFINE TRIANGLE POSITION
LOAD X,Y,TOTAL,POINT,
IF(TOTAL=22 OR X=Y,'NONE',
IF(TOTAL>=23 AND Y>X,'TOP',
IF(TOTAL<23 AND Y>X,'LEFT',
IF(TOTAL>=23 AND Y<X,'RIGHT',
IF(TOTAL<23 AND Y<X,'BOTTOM'))))) AS Position;

LOAD X&'|'&Y AS POINT,
X+Y AS TOTAL,
X,Y
RESIDENT TMP;

DROP TABLE TMP;
Once you know where each dot belongs to, is time to color each one of the quadrants. You can reuse the field "Position" in Color by Expression :
if(Position='NONE',rgb(255,255,255),
 if(Position='TOP',rgb(231, 76, 60),
  if(Position='RIGHT',rgb(41, 128, 185),
   if(Position='BOTTOM',rgb(230, 126, 34),
    if(Position='LEFT',rgb(22, 160, 133)
)))))
Displaying KPI in the grid
In my example, I have four metrics and one dimension, year, containing two values. Since each quarter is made up of 100 points, it is time to asing them a value from 1 to 100 starting from the center dot. This way you will be able to control how the sections will fill up. You want them to fill up starting from the center outwards.
In the load script, is time to create a new field called "NoPoint" as shown below
Top:
load Position,X,Y,RowNo() as NoPointT Resident Data
Where Position ='TOP'
Order by Y asc;

Right:
load Position,X,Y,rowno() as NoPointR Resident Data
Where Position ='RIGHT'
Order by X asc;

Bottom:
load Position,X,Y,RowNo() as NoPointB Resident Data
Where Position ='BOTTOM'
Order by Y desc;

Left:
load Position,X,Y,rowno() as NoPointL Resident Data
Where Position ='LEFT'
Order by X desc;


All:
LOAD Position,X,Y,NoPointT as NoPoint Resident Top;
Concatenate(All)
LOAD Position,X,Y,NoPointR as NoPoint Resident Right;
Concatenate(All)
LOAD Position,X,Y,NoPointB as NoPoint Resident Bottom;
Concatenate(All)
LOAD Position,X,Y,NoPointL as NoPoint Resident Left;

join(Data)
LOAD * resident All;

Drop tables All,Top,Right,Bottom,Left;
Finally, go back to the chart coloring properties panel and add each KPI like
Position='TOP' and Sum({$<Metric={'Sales'}>}Percentage)*100>=NoPointBy know, your color expression should be something like this
if(X+Y=22 or X=Y,'#ffffff',
 if(Position='TOP' and Sum({$<Metric={'Sales'}>}Percentage)*100>=NoPoint,'#e74c3c',
  if(Position='RIGHT' and Sum({$<Metric={'Profit'}>}Percentage)*100>=NoPoint,'#2980b9',
   if(Position='BOTTOM',
    if(Sum({$<Metric={'Headcount'}>}Percentage)*100>=NoPoint,'#e67e22','#bdc3c7'),
     if(Position='LEFT',
      if(Sum({$<Metric={'Cost'}>}Percentage)*100>=NoPoint,'#16a085','#bdc3c7')
,'#bdc3c7')
         )
        )
       )
      )
To complete your chart remember to hide what you don't need in there, the Labels and Titles for X and Y and Voila !
Thanks for reading and find more chart hijacking at https://www.qreatic.fr/dailyqlikchallenge/category/Charts+Hijacking
Christophe Brault
PS: Check Christophe's Dot Quadrant app attached

-
February Webinar Schedule
Hello Qlik Users!We are a few days into the month already!Here is the February webinar schedule: February 4th, 2021 Event: Do More with Qlik – for Beginners and BeyondTopic: Fun with VariablesTime: 2pm ESTSign up hereFebruary 9th, 2021Event: Talk to Experts TuesdayTopic: GeoAnalytics/GeoOperationsTime: 10am ESTSign up hereFebruary 18th, 2021 Event: Support Techspert ThursdayTopic: Configure & Recover Db2 Purescale as a Qlik Replicate Source Endpo... Show MoreHello Qlik Users!
We are a few days into the month already!
Here is the February webinar schedule:
February 4th, 2021
Event: Do More with Qlik – for Beginners and Beyond
Topic: Fun with Variables
Time: 2pm EST
February 9th, 2021
Event: Talk to Experts Tuesday
Topic: GeoAnalytics/GeoOperations
Time: 10am EST
February 18th, 2021
Event: Support Techspert Thursday
Topic: Configure & Recover Db2 Purescale as a Qlik Replicate Source Endpoint
Time: Multiple times available
February 23rd, 2021
Event: Talk to Experts Tuesday
Topic: Qlik Compose
Time: 10am EST
Don’t forget – there are other On Demand webinars available on the Events page. Please let us know if you have any questions about these sessions or if there is anything you would like to see in the future.
Make sure you’re subscribed to Qlik Support Updates Blog so you will be notified of everything happening with Qlik Support. Also, please give this blog a “Like” if you found it useful!
Have a wonderful day and thank you for choosing Qlik!
Kind regards,
Qlik Digital Support
-
Changes to the Premium Qlik Web Connectors
Hello Qlik Users!If you saw today's Product Innovation Blog post, Premium Web Connectors are now a part of the standard package! For more information on this change, please see Premium Web Connectors are now free to all Qlik Analytics customers.You can find information about using these connectors on the Built-in Qlik Web Connectors Help page. Here are some additional resources I have collected for some of the more popular (previously Premium) co... Show MoreHello Qlik Users!
If you saw today's Product Innovation Blog post, Premium Web Connectors are now a part of the standard package! For more information on this change, please see Premium Web Connectors are now free to all Qlik Analytics customers.
You can find information about using these connectors on the Built-in Qlik Web Connectors Help page. Here are some additional resources I have collected for some of the more popular (previously Premium) connectors:
Qlik Facebook Connector
- Difference between the Qlik Web Connectors Facebook Connectors
- How to connect to Facebook Ads with Qlik Connectors
- Search results on Qlik Community for “Facebook connector”
Qlik OData Connector
- Configure Basic authentication in ODATA web connector (Community post)
- Search results on Qlik Community for “Odata connector”
Qlik Office 365 Sharepoint Connector
- How to load a file from SharePoint 365 using Qlik Using Qlik Web Connectors (includes video)
- Need help with O365 SharePoint connector (Community Post)
- Search results on Qlik Community for “Sharepoint connector”
Here is some general information about Qlik Web Connectors:
- Installing Qlik Web Connectors (Qlik Help)
- Advanced Qlik Web Connectors installation (Qlik Help)
- Setting up Qlik Web Connectors to run as a Windows service (Qlik Help)
- STT - Configuring and Troubleshooting Web Connectors (Video)
If you have any questions about using the Qlik Web Connectors, consider searching the Qlik Community for answers (searching here will search all of our platforms!) or posting to the Qlik Connectors forum.
Please let us know if you have any questions about the changes made regarding Premium Web Connectors using the comments below. If you found this information useful, please give the post a Like!
Thank you for choosing Qlik!
Kind regards,
Qlik Digital Support
-
Deakin University students learn analytics from Qlik experts
Recently, Qlik experts Nabeel Asif and Aaron Young conducted a session on data analytics using Qlik Sense for students of Deakin University in Australia. Established in 1974, Deakin University is a multi-award winning and internationally recognized university in Victoria, Australia. They offer students an outstanding learning experience and host over 15,000 international students from 130 different countries. Deakin University consistently ranks ... Show MoreRecently, Qlik experts Nabeel Asif and Aaron Young conducted a session on data analytics using Qlik Sense for students of Deakin University in Australia.
Established in 1974, Deakin University is a multi-award winning and internationally recognized university in Victoria, Australia. They offer students an outstanding learning experience and host over 15,000 international students from 130 different countries. Deakin University consistently ranks highly in undergraduate student satisfaction; in the 2019 Student Experience Survey, Deakin had the fourth highest student satisfaction rating nationally and the highest student satisfaction rating out of all Victorian universities
Professor Kristijan Mirkovski from the University organised this session for his students pursuing their Bachelors in Business Analytics He felt the need to enlighten students with Qlik Sense since students would find it useful for their career. Data analytics is among the top skills and the Qlik Academic Program offers an up to date learning experience through its various offerings which are free for students and Professors.
The session began with providing an overview of the Qlik platform and a demo of Qlik Sense and Qlik Insight bot. Nabeel and Aaron educated students on how to use Qlik Sense by loading data, creating sheets and visualisations and creating apps. A considerable amount of time was also spent on introduction and demo of advanced analytics with Qlik. According to Krisitijan, students were most impressed by the hands-on exercises, which they found extremely useful
There are further plans to conduct similar sessions with Deakin University and also introduce the benefits of the analytics technologies developed by Qlik through the Qlik Academic Program
If you are keen to know about how you can learn and teach analytics in your University, visit: qlik.com/academicprogram or write into academicprogram@qlik.com
-
Celebrate Black History Month with Qlik
February is Black History Month. The Qlik Black Alliance ERG is excited to kick off this year’s Black History Month observation and celebration by sharing three Zoom Backgrounds for all to use!