Unlock a world of possibilities! Login now and discover the exclusive benefits awaiting you.
This space offers a variety of blogs, all written by Qlik employees. Product and non product related.
Product Innovation
By reading the Product Innovation blog, you will learn about what's new across all of the products in our growing Qlik product portfolio.
Support Updates
The Support Updates blog delivers important and useful Qlik Support information about end-of-product support, new service releases, and general support topics.
Qlik Academic Program
This blog was created for professors and students using Qlik within academia.
Community News
Hear it from your Community Managers! The Community News blog provides updates about the Qlik Community Platform and other news and important announcements.
Qlik Digest
The Qlik Digest is your essential monthly low-down of the need-to-know product updates, events, and resources from Qlik.
Qlik Education
The Qlik Education blog provides information about the latest updates of our courses and programs with the Qlik Education team.
Recent Blog Posts
-
Qlik Sense Desktop June 2020 Install Issue Update
Hello Qlik Users!Last week I blogged about a Qlik Sense Desktop June 2020 Install Issue. To recap, the software would crash when authenticating if a previous version of Qlik Sense Desktop had been installed.I am happy to report that this issue is resolved in the Qlik Sense Desktop June 2020 Patch 2 installer. The release is now available on the Qlik download site. After installing, verify the version installed is Qlik Sense Desktop June 2020 Patc... Show MoreHello Qlik Users!
Last week I blogged about a Qlik Sense Desktop June 2020 Install Issue. To recap, the software would crash when authenticating if a previous version of Qlik Sense Desktop had been installed.
I am happy to report that this issue is resolved in the Qlik Sense Desktop June 2020 Patch 2 installer. The release is now available on the Qlik download site. After installing, verify the version installed is Qlik Sense Desktop June 2020 Patch 2 Update 1.
It was also communicated that the free version of Qlik Sense Desktop was to end on June 30, 2020. Due to the authentication issue, it was pushed back. The new end date for the free version of Qlik Sense Desktop is now July 14, 2020.
Users will still be able to access their Qlik Sense Apps via their local file system (default path is C:\Users\username\Documents\Qlik\Sense\Apps) and copy the files to other editions of Qlik Sense.
To continue working in Qlik Sense Desktop, users must authenticate against either SaaS editions of Qlik Sense or Qlik Sense Enterprise on Windows. Please note: Authentication against Qlik Sense Enterprise on Windows requires a professional license.
Qlik Sense Desktop authentication within SaaS editions of Qlik Sense.
For more information, please see the Changes to Qlik Sense Desktop in 2020 FAQ.
If you have any questions, please let us know in the comments below and we will reach out to the appropriate team if we do not have the answer. Please give this post a like if you found it useful and don’t forget to subscribe to the Qlik Support Updates Blog to stay up-to-date!
Kind regards,
Qlik Digital Support
-
QlikView 11.20 Support Expires December 31, 2020
Hello Qlik Users!The Holidays are in full swing! We know how busy this time of year gets so I wanted to remind everyone:QlikView 11.20 support and maintenance will expire on December 31, 2020.What does this mean?For the full benefits of Qlik’s support services, clients must be on one of the following versions:QlikView 12.30: Support & Maintenance will expire on April 30, 2021.QlikView 12.40: Support & Maintenance will expire on April 30, 2022.Qli... Show MoreHello Qlik Users!
The Holidays are in full swing! We know how busy this time of year gets so I wanted to remind everyone:
QlikView 11.20 support and maintenance will expire on December 31, 2020.
What does this mean?
For the full benefits of Qlik’s support services, clients must be on one of the following versions:
- QlikView 12.30: Support & Maintenance will expire on April 30, 2021.
- QlikView 12.40: Support & Maintenance will expire on April 30, 2022.
- QlikView 12.50: Support & Maintenance will expire 24 months following the release of QlikView 12.60
If you recall, QlikView 12.20 support and maintenance expired on November 30, 2020.
Here are some resources to help facilitate a smooth upgrade:
- How to Upgrade or Migrate QlikView 11.20 and later versions
- QlikView 11.20 End of Life Upgrade: Known Issues and changes in product behavior
- A QlikView Upgrade Guide
- STT- Worry Free Migration for QlikView Server/Publisher
Please make sure you’re following best practices when upgrading:
- Read the release notes
- Make a backup the current environment
- Test the newer version in a test or QA environment prior to promoting to production
- Check the support matrix for any other Qlik Value Added Products to ensure compatibility
Some clients are taking this time to the adopt the Analytics Modernization Program. This program allows you to integrate Qlik Sense at your own pace while still using QlikView. We recently held a Talk to Experts Tuesday on the topic, so check out the recording or the FAQ for the most common questions and answers.
Your account team can assist in determining the best course of action. Please reach out to your Account Manager to discuss upgrading to a newer version of QlikView if assistance is required or the Analytics Modernization Program.
Please let us know if you have any questions in the comments below. If you found this blog useful, please give it a ‘Like’! Make sure you’re subscribed to the Qlik Support Updates Blog to receive updates like this.
Thank you for choosing Qlik!
Kind regards,
Qlik Digital Support
-
-
If you missed yesterday’s Support Techspert Thursday…
Hello Qlik Users!If you missed yesterday’s STT on Top 5 Things to Know when Using Qlik Sense SaaS, it has already been posted to the Support Techspert Thursday landing page!In the STT, Akki reviews everything from logging into Qlik Sense SaaS to setting up the SMTP settings to receive email notifications. If you’re new to Qlik Sense SaaS, this is a great (and quick) video to watch! He takes you through getting started step by step in 20 minutes.I... Show MoreHello Qlik Users!
If you missed yesterday’s STT on Top 5 Things to Know when Using Qlik Sense SaaS, it has already been posted to the Support Techspert Thursday landing page!
In the STT, Akki reviews everything from logging into Qlik Sense SaaS to setting up the SMTP settings to receive email notifications. If you’re new to Qlik Sense SaaS, this is a great (and quick) video to watch! He takes you through getting started step by step in 20 minutes.
If you have any questions, please let us know in the comments below. Want to share something you created? See Introducing Featured Content Friday! for more information on submitting your dashboards, workarounds, how-to’s and more!
Have a great weekend!
Kind regards,
Qlik Digital Support
-
SaaS Editions of Qlik Sense – December 2020 Monthly Update
Hello Qlik Users!This past Tuesday the December 2020 monthly update was pushed out. This release focused heavily on connectors - expanding the available connectors and updating some older connectors. The following updates were made:Ability to access Shared drives in Google Drive and SpreadsheetGoogle AdWords & Dropbox is now available in the data manager (it was only available in the Data Load Editor before)A new UI for Azure SynapseSlack connect... Show MoreHello Qlik Users!
This past Tuesday the December 2020 monthly update was pushed out. This release focused heavily on connectors - expanding the available connectors and updating some older connectors. The following updates were made:
- Ability to access Shared drives in Google Drive and Spreadsheet
- Google AdWords & Dropbox is now available in the data manager (it was only available in the Data Load Editor before)
- A new UI for Azure Synapse
- Slack connector is replaced by Slack v2*
- AYLIEN News was replaced by AYLIEN News v2*
- YouTube Analytics is now available and replaces YouTube Data
Since the beginning of 2020, the number of connectors added to our SaaS platform has been substantial. What has been your favorite addition?
This is the last monthly SaaS update for 2020 but the team will be back next year with some new features and enhancements. If you would like to read up more on some of the changes over the year for data connectivity, check out the Qlik Product Innovation Blog’s post A Time to Connect and Reflect.
Please give this post a like if you found it helpful! Subscribe to the Qlik Support Updates Blog by clicking the green Subscribe button if you haven’t already. Also, please let us know if you have any questions or leave your feedback in the comments.
Thank you for choosing Qlik!
Kind Regards,
Qlik Global Support
*If you’re using the Slack, AYLIEN News, or Bitly connectors, please see our blog post from Tuesday.
-
Monitor Visualizations in the Cloud Hub
Did you know that you can monitor visualizations in the cloud hub? Visualizations from sheets in an app and from Insight Advisor can be selected for monitoring. Once selected, these visualizations will appear in the cloud hub in the Your charts section on the Home page and under Charts on the Explore page. Charts can be saved with or without selections and are refreshed every time the source app reloads. Let’s look at how it is done.In the image ... Show MoreDid you know that you can monitor visualizations in the cloud hub? Visualizations from sheets in an app and from Insight Advisor can be selected for monitoring. Once selected, these visualizations will appear in the cloud hub in the Your charts section on the Home page and under Charts on the Explore page. Charts can be saved with or without selections and are refreshed every time the source app reloads. Let’s look at how it is done.
In the image below, the bar chart is on a sheet in my app. Right click on the chart and then click on the eclipse (…) to see the Monitor in hub option displayed below. In the Insight Advisor, the eclipse is in the top right of the chart. Any selections applied to the chart will be saved and applied to the chart that you are monitoring.
What is nice about this is you can keep an eye on a specific chart without having to open the app and navigate to the visualization. The latest reloaded version of the chart is always the one that is visible in your cloud hub as seen below.
If you want to look at the chart in the app, that is easy to do. When you hover over the chart, there are 2 options: View chart and View in app. View chart will open the latest reloaded version of the chart. Selections cannot be made from here, but they can be made if View in the app is selected. View in the app will open the chart in the app or in Insight Advisor depending on where the source chart was selected. From Home or Explore, you can also click on the eclipse in the lower right of the chart to:
- See details about the chart such as the reload history
- Add the chart to a collection
- Edit some properties of the chart
- Delete the chart from monitoring
Another nice feature is you can compare versions of the chart. To do this, select the View chart option. From here, you can not only see the latest version of the chart you are monitoring but you can view previous versions of the chart. You can also compare 2 versions of the chart. When you hover over a chart in the Chart history section that is not selected, you will see a 1 and/or 2 in the right top corner of the chart. Selecting 1 will move the chart to the left side of the selected chart for comparison. Selecting 2 will move the chart to the right side of the selected chart for comparison. In the image below, the latest reloaded chart is selected and when I hover over the previous chart, I can see the 2 in the upper right that I can select if I want to compare it to the selected visualization.
Monitoring your charts in your personal space in the cloud hub gives you a new level of flexibility and allows you to see what visualizations are important to you quickly with options to explore them further, if needed. Check out Michael Tarallo's Qlik Sense in 60 - Chart Monitoring video to quickly see how it is done and see Qlik Help for more information on monitoring your visualizations in the cloud hub.
Thanks!
-
Accumulative Sums
We all use QlikCommunity when we need an answer for a QlikView question. We post a question and get an answer, usually in minutes, leveraging the expertise of 91,000+ QlikView users! QlikCommunity is the most-visited and active user community in the BI industry.I also use QlikCommunity. And sometimes not to get an answer for a question but to think about new ways of doing things by reading the answers on the existing posts. So I have been curious... Show MoreWe all use QlikCommunity when we need an answer for a QlikView question. We post a question and get an answer, usually in minutes, leveraging the expertise of 91,000+ QlikView users! QlikCommunity is the most-visited and active user community in the BI industry.
I also use QlikCommunity. And sometimes not to get an answer for a question but to think about new ways of doing things by reading the answers on the existing posts. So I have been curious about the answers on calculating the accumulative sums in QlikView and did a search on QlikCommunity. There are many answers provided as expected. Here is one way of achieving it by using rangesum() and aggr() functions.
It is a very common requirement to display the accumulative sum of a chart metric. The easiest way of doing this is to use the accumulate setting under the expressions tab of chart property.
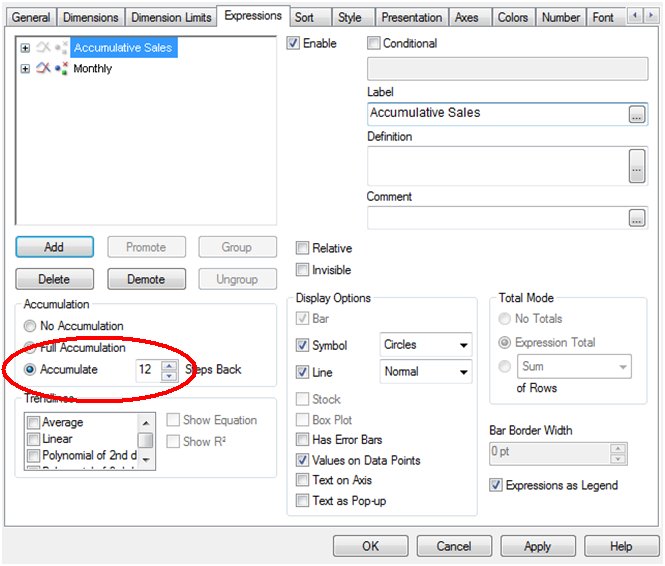
Figure 1. Accumulate option on chart property
With this setting, the values of the selected metric will be accumulated. But sometimes, the requirement is to have the first data point accumulated as well. For example, to show the accumulated sales for 12 months where the first month displayed should be the sum of the previous 12 months and the following months should accumulate on top of this value by adding one month at a time. One way of achieving this is to use the rangesum() and the aggr() functions together.
Let us first look at Rangesum(). It is a range function that returns the sum of a range of 1 to N arguments Together with the above() function, you can calculate the sum of the last 12 months;
rangesum( above( sum(Sales),0,12) )
This expression will return the sum of sales evaluated for each month as they appear on the 12 rows above the current row.
The next step is to combine RangeSum() with the aggr() function to aggregate the sum of sales for the 12 months at the month level.
sum( aggr( rangesum( above( sum(Sales),0,12) ),Month))
Using the Aggr() function, it is possible to calculate the accumulated sum for any other dimensions in addition to the time dimension. For example, the 12 months accumulated sum of sales by store can be calculated as;
sum( aggr( rangesum( above( sum(Sales),0,12) ),Month, Store))
Optionally you could also clear any selections on the month field as the calculation should reflect the accumulated sales for the previous 12 months, regardless of selections. This is achieved by using the set analysis “{$<Month>}”.
sum( aggr( rangesum( above( sum( {$<Month>} Sales),0,12) ),Month))
One important thing to notice with this solution is the sort order inside the aggr() function. If the sort order is not correct, the aggregated sum of the 12 months would not be correct. QlikView always sorts the groupings (in this case the groups defined by the second parameter of the aggr() function) according to the load order. If the data is sorted by date during the load, QlikView will use this order and the aggr() function will show the correct totals for the desired time frame.
In summary, the accumulation option on the expression tab is the simplest way of achieving accumulations, but the use of rangesum() and aggr() functions are alternative ways of accumulating the data in more complex situations.

-
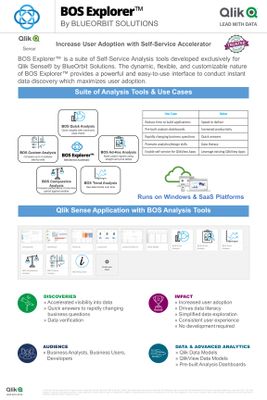
BOS Explorer™ - Self-Service Accelerator for Qlik Sense
To Experience BOS Explorer™ - Click Here -
The Qlik Support Portal search engine is being upgraded today!
Hello Qlik Users!Today is a very exciting day!The search engine on the Qlik Support Portal will be upgraded today to a new unified search engine. With the upgrade, you will still be able to search multiple platforms including the Knowledge Base, Community posts, YouTube, Ideas and Qlik Help.The Ideas section is a new addition to the search and will show results from the Ideas Board in Qlik Community matching your search term. You will no longer n... Show MoreHello Qlik Users!
Today is a very exciting day!
The search engine on the Qlik Support Portal will be upgraded today to a new unified search engine. With the upgrade, you will still be able to search multiple platforms including the Knowledge Base, Community posts, YouTube, Ideas and Qlik Help.
The Ideas section is a new addition to the search and will show results from the Ideas Board in Qlik Community matching your search term. You will no longer need to search a separate board to see if the idea exists – you will be able to find out during your initial search!
In the coming weeks, Qlik Community will be updated with the same search engine followed by Qlik Help during Q1 of 2021. With these upgrades, we hope to enhance your experience with a unified search across all our platforms. We will keep you updated on the progress for those platforms.
With today’s upgrade of the Support Portal, you may experience intermittent search issues. Please let us know of any issues you encounter or any feedback using the comments below.
We thank you for your patience during this upgrade as we focus on improving our self-service solution.
Thank you for choosing Qlik!
Kind regards,
Qlik Digital Support
-
Updates to the Qlik Continuous Classroom Course Search
Here in the Qlik Education team, we are always working on improving your user experience within the Qlik Continuous Classroom. One of the most recent improvements we have made is to our Course Search functionality. The Continuous Classroom Course Search is your one-stop shop for finding all Qlik Continuous Classroom self-paced learning. From this page, you can filter by Product, User Role, Level, Product Release, Category and Price. You can al... Show MoreHere in the Qlik Education team, we are always working on improving your user experience within the Qlik Continuous Classroom. One of the most recent improvements we have made is to our Course Search functionality.
The Continuous Classroom Course Search is your one-stop shop for finding all Qlik Continuous Classroom self-paced learning. From this page, you can filter by Product, User Role, Level, Product Release, Category and Price. You can also use the Search field to find courses with specific words or phrases.
After making your selections, course results are now returned to you sorted by Course Order as the default setting, arranging courses in a recommended order of completion. So you can search for courses based on your interest or need using the filters and Search field, and get started learning immediately in the recommended order of learning by starting with the first course on the upper right of the results, then work your way through the list!
Not interested in seeing your course results in a recommended order of completion? You can also change the ‘Sort by’ option to Newest First, A to Z, Z to A or Free First.
We hope this improvement will positively impact your user experience! Happy Learning!
Questions about the Qlik Continuous Classroom? Email education@qlik.com.
-
The Qlik Insight Advisor - More than JUST ASKing questions!
Hey Guys - a few weeks ago I introduced the Qlik Cognitive Engine in the Design Blog, What is the Cognitive Engine? and how it is responsible for providing an (AI) Augmented Intelligence driven experience. BUT...exactly what does that mean - "Augmented Intelligence driven experience"? Sounds like marketing-speak, right? Actually, it's not a play on words. These are powerful terms that represent machine learning AND human intuition. Simply s... Show MoreHey Guys - a few weeks ago I introduced the Qlik Cognitive Engine in the Design Blog, What is the Cognitive Engine? and how it is responsible for providing an (AI) Augmented Intelligence driven experience. BUT...exactly what does that mean - "Augmented Intelligence driven experience"? Sounds like marketing-speak, right? Actually, it's not a play on words. These are powerful terms that represent machine learning AND human intuition. Simply stated - instead of just solely relying on pure machine automation, as you may find with typical Artificial Intelligence applications, Augmented Intelligence works with human interaction and perspective to solve complex business problems. And when combined with our proven, super-fast, patented Associative Indexing technology - you enable context-aware suggestions that help you ask those random questions or spot hidden insights while exploring data freely. So let me see - (Augmented Intelligence + Associative Indexing) .....hmmmm...I think I'll now call this AI² -
 - The Cognitive Engine is what powers our automated chart suggestions and our new Insight Advisor available in Qlik Sense. With the Insight Advisor you can search a governed library of familiar business terms that produce multiple insights for you to explore instead of a just a single presentation of data. The Insight Advisor allows you to do so much more than just ask data questions. It can be used as a way to jump start the creation of your analytics, or better yet, as you explore and make selections - new questions may be triggered and at that moment you can open the Insight Advisor and search while in the CONTEXT of your exploration using familiar business terms to find what you are looking for. Taking this one step further, the Cognitive Engine not only learns from the data, but your behavior as well, allowing you to teach the Cognitive Engine so it produced significantly relevant insights for you to explore. Want to learn more and see this in action? Check out this brief video and let us know what you think, we want to hear from you.
Regards,
Qlik
The Insight Advisor
NOTE: Can't see the video? YouTube blocked by your organization or region? No problem, just download the attached .mp4 file to watch on your computer or mobile device.

-
Monitor, Explore, Create - Get Notified - Simplistic Qlik Sense Analysis Flow - ...
Hey guys - a large percentage of my time is spent showcasing all the great features and capabilities that Qlik products have to offer. BUT usually, a small percentage shows how they all work or fit together. I feel that telling stories and showing a process from beginning to end, all while keeping it brief and simple is the best way to introduce a topic of interest. In this brief 2 min video, I take you from monitoring, to exploring, to the creat... Show MoreHey guys - a large percentage of my time is spent showcasing all the great features and capabilities that Qlik products have to offer. BUT usually, a small percentage shows how they all work or fit together. I feel that telling stories and showing a process from beginning to end, all while keeping it brief and simple is the best way to introduce a topic of interest. In this brief 2 min video, I take you from monitoring, to exploring, to the creation of an intelligent alert to get notified of changes in your data.
(Video transcript attached below)
Granted, some of these examples I use can be seen as an oversimplification in the grand scheme of things - but are they really an oversimplification? Just because the data is based on a collection of video games is it really different than that of stocks, or products for sale, or insurance portfolios, or pharmaceuticals, logistics, healthcare data etc. you get my point. Data is a combination of time, measures, locations, categories, expressions - basically the numerical components along with the who, what, when and where etc. and when made ready for analysis it can answer your questions that will help make informed decisions or identify problems to be addressed, or processes that should be repeated.
For this example and others I have created, it just so happens that this data speaks to me, it is interesting and it allows me to understand all the features, capabilities and possibilities with Qlik Sense to allow me to share them with you in an easy to explain fashion and perhaps in a manner that you can relate to. I recommend everyone use a dataset that they love and want to know more about when learning all the new features or functions that Qlik Sense has to offer.
Tell me what you think and if so - tell me what datasets you use and find interesting to help you understand Qlik Sense.
Features shown in this video:
- Chart Monitoring: https://youtu.be/MFXPZ_uffzs
https://help.qlik.com/en-US/cloud-services/Subsystems/Hub/Content/Sense_Hub/Hub/monitor-charts-hub.htm - Data Alerts: https://www.youtube.com/watch?v=V6szm8jjzuA
https://help.qlik.com/en-US/cloud-services/Subsystems/Hub/Content/Sense_Hub/Alerting/monitoring-changes-with-alerts.htm - MGO Image Grid:
https://developer.qlik.com/garden/56e8f64ee37930b98cf9dea4
- Chart Monitoring: https://youtu.be/MFXPZ_uffzs
-
A Time to Connect and Reflect
Qlik Sense December 2020 Release to cloud - providing more data connections and improved experience. -
New Qlik Web Connectors Package - available now!
The December 2020 release of the Qlik Web Connectors package is now available to download! This new package includes new features and API performance improvements. -
-
Free Workshop: Build Your First Qlik Sense App
Join us for the upcoming, hands-on workshops to learn how to build a Qlik Sense application and experience some of the functionality and add on products that will increase data awareness and availability in your company.You will also learn how to accelerate your ramp up and implementation of Qlik Sense through various Qlik training options...with a special offer at the end of the workshop. 3-hour sessions will be held weekly in multiple time zon... Show MoreJoin us for the upcoming, hands-on workshops to learn how to build a Qlik Sense application and experience some of the functionality and add on products that will increase data awareness and availability in your company.
You will also learn how to accelerate your ramp up and implementation of Qlik Sense through various Qlik training options...with a special offer at the end of the workshop. 3-hour sessions will be held weekly in multiple time zones.
Space is limited, so register today using below link to secure your spot!
Find a webinar that works for you and register today.

-
New APIs for Web Connectors – existing connections must be updated
Hello Qlik Users,Five connectors are being replaced in the December 2020 release because the API to the sources have been updated, and the changes were so extensive that it wasn’t possible to modify the existing connectors. The affected connectors areAYLIEN NewsBitlySlackMicrosoft Dynamics CRMOneDriveNote that the Dynamics CRM and OneDrive Connectors are only impacted within the Standalone Web Connectors package.We’ve already released a new versi... Show MoreHello Qlik Users,
Five connectors are being replaced in the December 2020 release because the API to the sources have been updated, and the changes were so extensive that it wasn’t possible to modify the existing connectors. The affected connectors are
- AYLIEN News
- Bitly
- Slack
- Microsoft Dynamics CRM
- OneDrive
Note that the Dynamics CRM and OneDrive Connectors are only impacted within the Standalone Web Connectors package.
We’ve already released a new version for each of these connectors with the suffix V2, utilizing the new API. The new APIs have improvements in features as well as performance, and in most cases, there are new columns or data structures available. For specific details you can read more on the API documentation for each source, which can be found via links on the respective connector’s page in the Qlik Connectors Help.
The old connectors are now no longer available in Qlik Sense or the Standalone Web Connectors package as their legacy APIs have expired and using them doesn’t work anymore (except for Microsoft Dynamics CRM, which is still available under the deprecated tab in the Standalone Web Connectors application).
If you still have Qlik apps using connections based on the old versions of any of these connectors, you must recreate these connections with the V2 alternatives.
In addition to these replaced connectors, we have also removed the YouTube Data connector because of new restrictions that YouTube recently imposed. For this connector, unfortunately, there is no direct new replacement but we instead recommend using the already existing YouTube Analytics connector.
Kind regards,
Qlik Global Support
-
The last Talk to Experts Tuesday session in 2020!
Hello Qlik Users,Next Tuesday, December 15th at 10am EST, is our last Talk to Experts Tuesday session for 2020! Join us to talk all things…QlikView!Register for the event here and let us know what kind of questions you have in the comments below. If you can’t make the session, use the registration form to enter your questions and we will still answer them during the session.Thank you for choosing Qlik!Kind regards,Qlik Digital Support -
Be Data Brilliant with the Qlik Academic Program
Preparing Students For The Future Workforce With Data Literacy
-
Sharing Qlik Love for the Holidays (Part II)
Two additional Zoom backgrounds available below.