Unlock a world of possibilities! Login now and discover the exclusive benefits awaiting you.
This space offers a variety of blogs, all written by Qlik employees. Product and non product related.
Product Innovation
By reading the Product Innovation blog, you will learn about what's new across all of the products in our growing Qlik product portfolio.
Support Updates
The Support Updates blog delivers important and useful Qlik Support information about end-of-product support, new service releases, and general support topics.
Qlik Academic Program
This blog was created for professors and students using Qlik within academia.
Community News
Hear it from your Community Managers! The Community News blog provides updates about the Qlik Community Platform and other news and important announcements.
Qlik Digest
The Qlik Digest is your essential monthly low-down of the need-to-know product updates, events, and resources from Qlik.
Qlik Education
The Qlik Education blog provides information about the latest updates of our courses and programs with the Qlik Education team.
Recent Blog Posts
-
Qlik Patch... Thursday! - New releases available now!
Hello Qlik Users,Happy Qlik Patch Wednesday Thursday! Thank you for bearing with us on getting these patches out. We have 3 patches available today for Qlik Sense on the Qlik download site:Qlik Sense Patch February 2020 Patch 6Release NotesApril 2020 Patch 5Release NotesJune 2020 Patch 3Release Notes Each Qlik Sense patch has a few fixes so please follow best practices when upgrading by backing up your Qlik Sense environment and testing the patch... Show MoreHello Qlik Users,
Happy Qlik Patch
WednesdayThursday! Thank you for bearing with us on getting these patches out. We have 3 patches available today for Qlik Sense on the Qlik download site:Qlik Sense Patch
February 2020 Patch 6
April 2020 Patch 5
June 2020 Patch 3
Each Qlik Sense patch has a few fixes so please follow best practices when upgrading by backing up your Qlik Sense environment and testing the patch in a QA environment first. For more guidance on upgrade, see the Qlik Sense Upgrade guide. This guide was put together by the Qlik Digital Support team and offers step-by-step instructions, pictures and troubleshooting tips.
Also, I wanted to let you all know there will not be any patches released on July 29th or August 12th. The normal patch schedule will resume on August 26th as will the Qlik Patch Wednesday blog.
Be sure to subscribe to the Qlik Support Updates Blog by clicking the green Subscribe button to stay up-to-date with the latest releases. Please give this post a like if you found it helpful! Also, please let us know if you have any questions or leave your feedback in the comments.
Thank you for choosing Qlik!
Kind Regards,
Qlik Global Support
-
Qlik Patch Wednesday - Delayed
Qlik Patch Wednesday – DelayedHello Qlik Users,Happy Wednesday!Today’s blog is short and sweet. Usually I would be sharing the available patches but they are, unfortunately, delayed. I will update you all when this week’s patches are available on the Qlik Download Site.Have a wonderful day!Kind regards,Global Qlik Support -
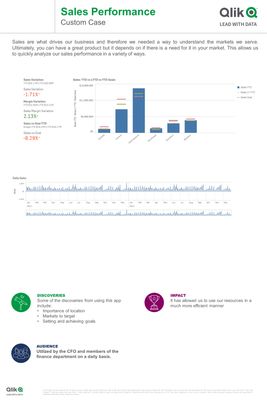
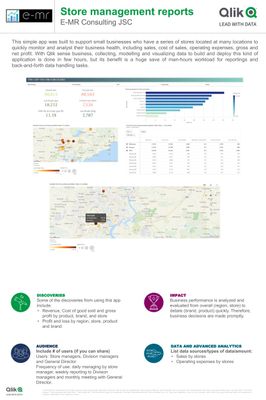
Store management dashboard
This simple app was built to support small businesses who have a series of stores located at many locations to quickly monitor and analyst their business health, including sales, cost of sales, operating expenses, gross and net profit. With Qlik sense business, collecting, modelling and visualizing data to build and deploy this kind of application is done in few hours, but its benefit is a huge save of man-hours workload for reporting and back-an... Show MoreThis simple app was built to support small businesses who have a series of stores located at many locations to quickly monitor and analyst their business health, including sales, cost of sales, operating expenses, gross and net profit. With Qlik sense business, collecting, modelling and visualizing data to build and deploy this kind of application is done in few hours, but its benefit is a huge save of man-hours workload for reporting and back-and-forth data handling tasks.
Sorry that some of text in app is in Vietnamese.

-
Cloud Editions of Qlik Sense - July Feature Release
June was a month that was nothing short of exciting. The June 2020 Release highlights included data analytics enhancements to augmented intelligence, visualizations, and connectivity as well as notable improvements to our data integration platform. No sooner was this release out the door that we launched QlikWorld Online - our annual global user conference. This was our first virtual QlikWorld event and it was bigger and better than ever. If you ... Show MoreJune was a month that was nothing short of exciting. The June 2020 Release highlights included data analytics enhancements to augmented intelligence, visualizations, and connectivity as well as notable improvements to our data integration platform. No sooner was this release out the door that we launched QlikWorld Online - our annual global user conference. This was our first virtual QlikWorld event and it was bigger and better than ever. If you missed the event, it is still available now here on-demand thru the summer to catch our keynotes, 100 breakout sessions and too many other resources to list in our Data Discovery Zone. At QlikWorld Online it was clear that Qlik is continuing to prove its position as a BI leader in its SaaS offering which is echoed in our July monthly release to the cloud.
Here’s a closer look at highlights of our July cloud release to further our innovations in SaaS for 2020.
-
Qlik Sense in 60 - Embed Sheet
Hey guys - it's been a while since I created a Qlik Sense in 60...so I'm back with a little feature that I just stumbled upon while creating some demonstrations using the Qlik Sense April 2019 release, Embed Sheet. If you found it before I did, be sure to share how you used it and what you did and perhaps did not like. This feature was taken from a single configurator that was available in the Qlik Sense Developer Hub and now brought front and ce... Show MoreHey guys - it's been a while since I created a Qlik Sense in 60...so I'm back with a little feature that I just stumbled upon while creating some demonstrations using the Qlik Sense April 2019 release, Embed Sheet. If you found it before I did, be sure to share how you used it and what you did and perhaps did not like. This feature was taken from a single configurator that was available in the Qlik Sense Developer Hub and now brought front and center so you can easily grab those analytics for other means. Take just 60 seconds to learn how you can embed your Qlik Sense analytics in blog posts, social media and other applications.
To learn a bit more about this feature, check out our help document and help video.
Enjoy!
Regards,
Mike Tarallo
Follow me on Twitter
-
What's New Qlik Product Release - June 2020
Qlik is pleased to announce the June 2020 product release, furthering our leadership in augmented intelligence, best in class visualizations, and platform extensibility. Also, this release delivers updates to several data integration products, including performance improvements, expanded cloud platform support, and new certifications. -
Demo (Fun) - Hero's and Villains.
Attached the QVF and Theme. The Theme was taken from https://sensetheme.com/gallery and slightly tweaked.
-
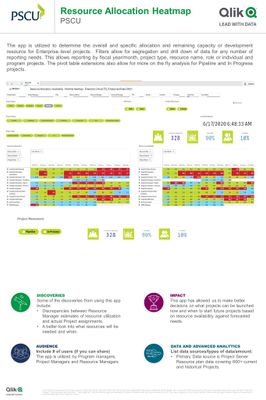
PSCU - Resource Heat Map
This app is utilized to determine the overall and specific allocation and remaining capacity or development resource for Enterprise level projects. Filters allow for segregation and drill down of data for any number of reporting needs. This allows reporting by fiscal year/month, project type, resource name, role or individual and program projects. The pivot table extensions also allow for more on the fly analysis for Pipeline and In Progress pro... Show MoreThis app is utilized to determine the overall and specific allocation and remaining capacity or development resource for Enterprise level projects. Filters allow for segregation and drill down of data for any number of reporting needs. This allows reporting by fiscal year/month, project type, resource name, role or individual and program projects. The pivot table extensions also allow for more on the fly analysis for Pipeline and In Progress projects.
-
Bank of Canada rates since 1991
Over the years, the Bank of Canada has adjusted the way it sets its key interest rate. This app provides data from StatsCan. The app provides different views of rates from Bank of Canada, money market and other interest rates since 1991. -
My Manuficaturing KPI App
This is a manufacturing KPI App showing the timelapses of manufacturing and delivery of every item with an image and custom tooltip for every product.
-
Do More with Qlik Webinar Series – Upcoming Dates
Hello Qlik Users!The July sessions for 'Do More with Qlik – For Beginners and Beyond' have been scheduled:July 9th, 2020 @ 2pm EDT/11am PDT: Qlik Associative DifferenceJuly 23rd, 2020 @ 2pm EDT/11am PDT: Qlik SaaS offerings with Denise LaForgia If you recall, this is Mike’s new webinar series that will review a different topic, product, feature or capability with each episode. Special guests (like Denise LaForgia for the July 23rd session) will c... Show MoreHello Qlik Users!
The July sessions for 'Do More with Qlik – For Beginners and Beyond' have been scheduled:
- July 9th, 2020 @ 2pm EDT/11am PDT: Qlik Associative Difference
- July 23rd, 2020 @ 2pm EDT/11am PDT: Qlik SaaS offerings with Denise LaForgia
If you recall, this is Mike’s new webinar series that will review a different topic, product, feature or capability with each episode. Special guests (like Denise LaForgia for the July 23rd session) will contribute to the series with the goal of demonstrating how to get more out of Qlik. Check out Mike’s LinkedIn or Twitter posts about the new webinar series for more details.
As always, please let us know if you have any questions. Give this post a like if you found it helpful and please share it with your colleagues! If you’re not already, subscribe to the Qlik Support Updates Blog to stay up-to-date!
Kind regards,
Qlik Digital Support
-
How to Get Started with Qlik Sense Business
Hello Qlik Users!Have you used our Qlik Sense Business solution already?This QlikFix video will show you how to get started: How to get started with Qlik Sense Business (QSB).For more QlikFix videos please access here. -
New Qlik Webinar Series - Do More with Qlik - for beginners & beyond with Mike ...
Hello Qlik Users!Mark your calendars!A new Qlik webinar series, Do More with Qlik - for beginners & beyond, with Mike Tarallo kicks off this Thursday, June 4th!Mike will cover a different topic, product, feature or capability with each episode that will show you how to get more out of Qlik. Special guests, including colleagues, Partners, and even Community users, will join Mike as well to showcase exciting solutions! Check out Mike’s LinkedIn or ... Show MoreHello Qlik Users!
Mark your calendars!
A new Qlik webinar series, Do More with Qlik - for beginners & beyond, with Mike Tarallo kicks off this Thursday, June 4th!
Mike will cover a different topic, product, feature or capability with each episode that will show you how to get more out of Qlik. Special guests, including colleagues, Partners, and even Community users, will join Mike as well to showcase exciting solutions! Check out Mike’s LinkedIn or Twitter posts about the new webinar series for more details.
There are two sessions already on the books:
- June 4th, 2020 @ 2pm EDT/11am PDT: Intro to the new program and a bit on Comparative Analytics
- June 18th, 2020 @ 2pm EDT/11am PDT: TBD - Special Guest Product Manager Jeff Goldberg talks about qlik-cli
As always, please let us know if you have any questions. Give this post a like if you found it helpful and please share it with your colleagues! If you’re not already, subscribe to the Qlik Support Updates Blog to stay up-to-date.
We can’t wait to see you Thursday!
Kind regards,
Qlik Global Support
-
Use Aggregation Functions!
On the discussion forum, I often see people posting questions around expressions that don’t work. When looking at the descriptions, I usually find that the reason is that the expressions lack aggregation functions. So, here is a suggestion... Always use an aggregation function in your expression. The reason is that a field reference in an expression always means an array of values. Which in turn means that you must enclose it in an aggregation fu... Show MoreOn the discussion forum, I often see people posting questions around expressions that don’t work. When looking at the descriptions, I usually find that the reason is that the expressions lack aggregation functions. So, here is a suggestion...
Always use an aggregation function in your expression.
The reason is that a field reference in an expression always means an array of values. Which in turn means that you must enclose it in an aggregation function to make it collapse into one value:
OrderDate An array of values
Max(OrderDate) A single value
If you don't use an aggregation function, QlikView will use the Only() function. Hence, if the field reference returns several values, QlikView will interpret it as NULL, and the expression will not be evaluated the way you want it to.
Example 1: Use of the If() function:
If() functions are often used for conditional aggregations:
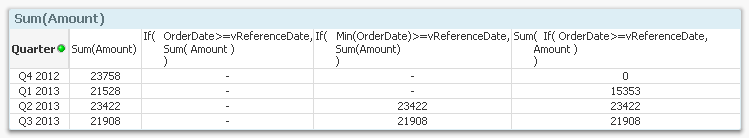
If( OrderDate >= vReferenceDate, Sum(Amount) )
At first glance, this expression may look correct: For dates after a reference date, the field Amount should be summed. Right?
Wrong.
OrderDate is a naked field reference: It does not have an aggregation function. Hence, it is an array, possibly with several values, and if so, evaluates to NULL. If you are lucky, there is only one date per dimensional value in your chart, and the expression will calculate fine. However, QlikView will probably not be able to calculate the expression for the subtotals in the chart, since there for those exists several dates.
A correct expression that always works should use a Min() or some other aggregation function in the first parameter of the If() function:
If( Min(OrderDate) >= vReferenceDate, Sum(Amount) )
Or, alternatively, the If() function should be put inside the Sum() function:
Sum( If(OrderDate >= vReferenceDate, Amount) )
In the first of the two expressions, the If() function will be evaluated once per dimensional value; in the second once per row in the raw data. The results are slightly different, but both return an answer, as opposed to the original expression. The picture below shows the difference between the expressions, using 2013-02-01 as reference date.
Example 2: Sort by expression:
The expression used to sort the dimensional values in a chart is also an aggregation. Often you don’t think about this since you choose an expression that returns just one value per dimensional value, and then a naked field reference works fine.
But sometimes this still doesn't work…
For example, say that you want to show support cases in a CRM system. You create a chart with the support case as dimension and some measure as expression. Of course you want to sort the support cases chronologically, so you use "Sort by Expression" and as expression you choose
[Opening Date]
This will work in most cases. However, some CRM systems allow you to re-open a support case, hence assigning two opening dates to one single support case. For these cases, the above expression will not work.
Instead, you should always ask yourself which function to use, should there be two values. The answer is usually Sum(), Avg(), Min() or Max(). In the above case, you should use
Min([Opening Date]) , or
Max([Opening Date])
depending on whether you want to use the first or last date.
Bottom line: Use aggregation functions, not just in your chart measures, but also in sort expressions, labels, show conditions, calculation conditions, text boxes, sheet names and searches.
Further reading related to this topic:

-
New Qlik Sense Business Video Playlist Available on YouTube!
Hello Qlik Users!I hope everyone had a wonderful weekend!Today I wanted to share a new playlist that was created on the Qlik Support YouTube channel. It is a collection of videos to help new users get acclimated with Qlik Sense Business. Topics include creating a tenant, inviting users, connecting to data sources, and more! You can find the Qlik Sense Business playlist here.The Qlik Support YouTube channel has a ton of other helpful videos regard... Show MoreHello Qlik Users!
I hope everyone had a wonderful weekend!
Today I wanted to share a new playlist that was created on the Qlik Support YouTube channel. It is a collection of videos to help new users get acclimated with Qlik Sense Business. Topics include creating a tenant, inviting users, connecting to data sources, and more!
You can find the Qlik Sense Business playlist here.
The Qlik Support YouTube channel has a ton of other helpful videos regarding Qlik products. Make sure you subscribe to the channel so you can be notified when new videos are posted!
If you found this post helpful or would like to see more content like this created, please be sure to give this post a like! If you haven’t already, make sure you’re also subscribed to the Qlik Support Updates Blog to stay updated on what’s happening within Qlik Support!
Thank you for choosing Qlik!
Kind Regards,
Qlik Digital Support
-
Data analytics skills to future proof your career post Covid
In a world that's altering many things including the way we live, work etc. everyone is curious to know which skills will remain in demand and which might see an increase. Various media publications are coming up with predictions on what might be the new normal in terms of future skill sets. A recent article in Hindustan Times writes, " as the society at large tried to grapple with the extent of the impact, technology has in many ways, emerged as... Show MoreIn a world that's altering many things including the way we live, work etc. everyone is curious to know which skills will remain in demand and which might see an increase. Various media publications are coming up with predictions on what might be the new normal in terms of future skill sets.
A recent article in Hindustan Times writes, " as the society at large tried to grapple with the extent of the impact, technology has in many ways, emerged as the savior". This article also mentions the top five skills in a post covid world and among these is the role of a Business Analyst. It adds. " as businesses accelerate the shift to digital, digital channels will become increasingly mainstream across sectors such as retail, education, healthcare and others. As the demand for digital goes up, it will result in greater demand for Business Analysts. To read about this article further,visit: https://www.hindustantimes.com/education/top-5-job-skills-to-future-proof-your-career-post-covid/story-7ibPE5zQu97F04VWcDxidP.html
Another recent article in Economic Times mentions the rising demand for data analytics professionals. There is a mention about a report by the US Bureau of Labour Statistics citing rising job openings to the tune of 11.5 million by 2026. The World Economic Forum predicts that by 2022, data scientists and analysts will become the number one emerging role in the world. To read this article in detail, visit: https://economictimes.indiatimes.com/magazines/panache/11-5-mn-job-openings-by-2026-sky-high-salaries-why-data-science-is-booming/articleshow/74667347.cms?from=mdr
If you are a student or Professor looking to learn data analytics, the Qlik Academic Program offers free resources in training, qualification and certification. To know more, visit: Qlik.com/academicprogram
If you would like to attend a webinar to learn about the Academic Program, register here: shorturl.at/EKMR8