Unlock a world of possibilities! Login now and discover the exclusive benefits awaiting you.
- Qlik Community
- :
- Support
- :
- Support
- :
- Knowledge
- :
- Support Articles
- :
- Missing data troubleshooting in Qlik Compose for D...
Options
- Subscribe to RSS Feed
- Mark as New
- Mark as Read
- Bookmark
- Subscribe
- Printer Friendly Page
- Report Inappropriate Content
Missing data troubleshooting in Qlik Compose for Data Lake
No ratings
Turn on suggestions
Auto-suggest helps you quickly narrow down your search results by suggesting possible matches as you type.
Showing results for
Support
- Mark as New
- Bookmark
- Subscribe
- Mute
- Subscribe to RSS Feed
- Permalink
- Report Inappropriate Content
Missing data troubleshooting in Qlik Compose for Data Lake
Last Update:
Feb 2, 2022 5:59:10 AM
Updated By:
Created date:
Apr 15, 2020 1:13:27 PM
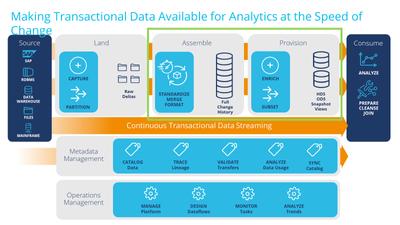
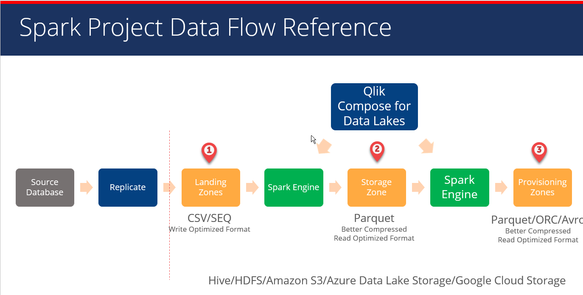
This article gives you an overview of the debugging steps for missing data in Qlik Compose for Data Lake (QC4DL). The Qlik Compose for Data Lake works with Qlik Replicate, and the data in __ct tables in Landing Area of the Replicate are assumed to be correct for these troubleshooting steps. The green box below stands for the QC4DL
Enabling logs to verbose mode to different modules of QC4DL can help you find the root cause of the missing data.
Setting up logs to verbose mode for different modules in QC4DL:
- Setting up server logs to verbose mode:
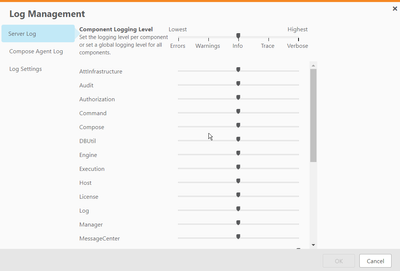
- From the Management menu, select Logs|Log Management.
- The Log Management window opens displaying the Server Log tab and - in a Spark project - the Compose for Data Lakes Agent tab will be displayed as well.
- Select the desired logging tab
- To set a global logging level for Compose for Data Lakes Server, move the top slider to the level you want. All the sliders for the individual modules move to the same level that you set in the main slider
- To set an individual logging level for Compose for Data Lakes Server components, select a module and then move its slider to the desired logging level.
Note: Changes to the logging level take place at once. There is no need to restart the Qlik Compose for Data Lakes service.
- Setting up Agent log to verbose mode:
- From the Management menu, select Logs|Log Management.
- The Log Management window opens, then select Compose Agent Log
- To set a verbose level for Agent, move its slider to Verbose (Highest) level.
- Click OK to save your changes and close the Log Management dialog box.
Note: Changes to the logging level take place at once. There is no need to restart the Qlik Compose for Data Lakes service.
- Setting up Storage task logs to verbose mode:
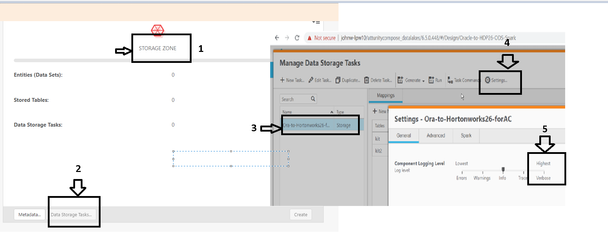
- Under the Storage Zone pane, select Data storage task, the Data Storage Sets window opens, select a Data Storage task set in the left pane and then click Settings.
- The Setting - <Storage task Name> dialog box opens.
- To set a verbose level for Storage task, move its slider to Verbose (Highest)
Note: Changes to the logging level take place at once. There is no need to restart the Qlik Compose for Data Lakes service
- Setting up Storage task logs to verbose mode:
Qlik Compose for Data Warehouse logs are in different locations:
The Server Logs files are located under: <product_dir>\data\log\Compose.log
Engine/ETL task logs are located under: <product_dir>\data\projects\[project_name]\logs\task_name\[run_Id].log
Agent logs are located under:
On Windows: <product_dir>\java\data\logs\agent.log
On Linux: /opt/attunity/compose-agent/data/log/agent.log.
Note: The agent logs can also be found on the remote machine where the agent is installed. The default location for the agent that’s installed on Linux is under “/opt/attunity/compose-agent/data/logs/agent.log”.
Compactor logs (ONLY for SPARK) are under:
On Windows: <product_dir>/data/projects/project_name/logs/etl_tasks/Compactor/logs
On Linux: “/opt/attunity/compose-agent/data/projects/<project name>/logs”
Note: The agent logs can also be found on the remote machine where the agent is installed. The default location for the agent that’s installed on Linux is under “/opt/attunity/compose-agent/data/logs/”. There should only be one compactor per project.
Spark history server logs (SPARK ONLY):
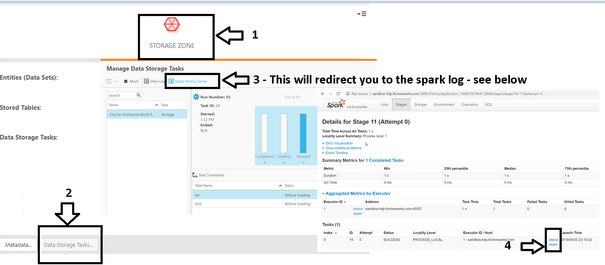
To access spark logs; from Storage zone pane, select Manage Data Storage, and then click on Spark History Server. This will redirect you to the corresponding “spark history server”, and in here click on the stdout/stderr for each task to see any error or any other information
Logs outside of QC4DL: Reviewing the HDFS Log, Yarn Log, Hive Server Log etc. outside of QC4DL will come in handy when debugging issues with QC4DL. - Checking missing data in different stages in QC4DL(SPARK):
The C4DL SPARK project has 3 stages – Landing Zone, Storage Zone and Provision Zone. The missing data can occur in any of the 3 stages.
Below describes how to confirm data in different stages: - Checking data in Landing zone: The table name is landing zone are prefixed __ct table and the data in this table assumed to be correct.
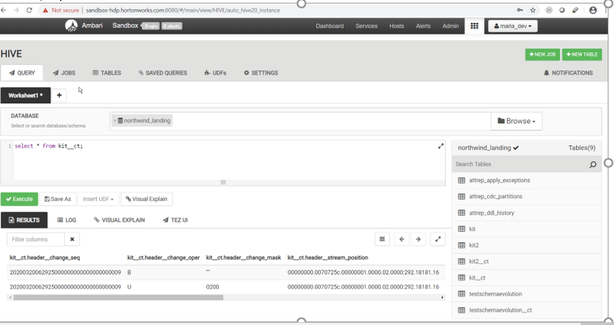
In the example below, in the __ct table there are 2 rows for a single update, one is from BeforeImage and the other is from AfterImage.
There are different ways to connect to landing zone database. “Hive” client in terminal, Hive query tool in Ambari, and 3rd party JDBC connection tool, SQL Workbench are some of the most used tools.
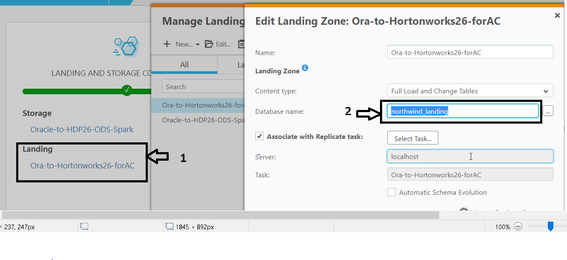
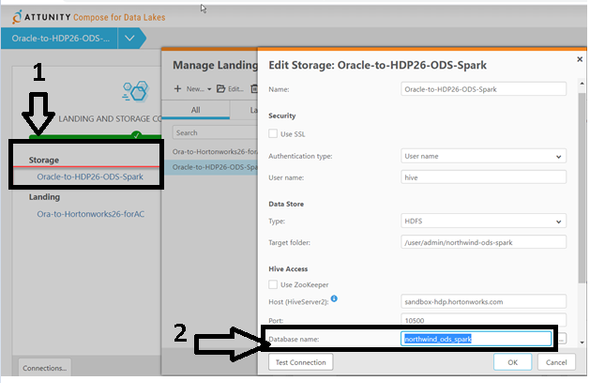
The connection information for landing database can be found from our UI under the Landing and storage database connection - see below:
Using “hive” client to query the data in the __ct table:
Using Hive query tool in Ambari:
Using SQL workbench: - Checking data in storage zone:
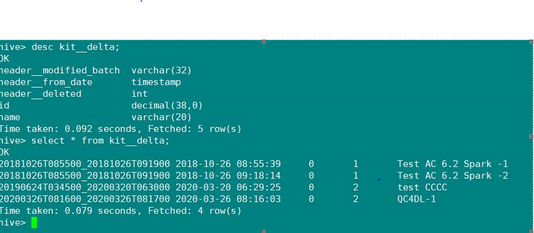
The storage zone tables are prefixed with __delta. __delta table will have 1 row with afterimage, the header information and delete the flag information.
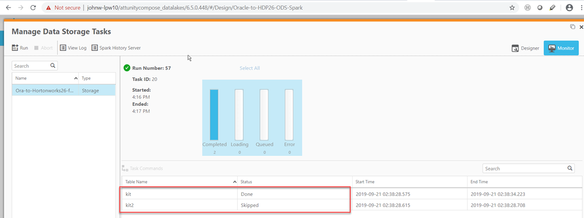
Run the Storage tasks, and note down the “status”
Done – data updated
Skipped – no data updated
The connection information for storage database can be found from our UI under the Landing and storage database connection - see below
There are different ways to connect to landing zone database. “Hive” client in terminal, Hive query tool in Ambari, and 3rd party JDBC connection tool, SQL Workbench are some of the most used tools. Below is an example using “Hive” client.
Using “hive” client to query the data in the __delta table: - Checking data in Provision zone:
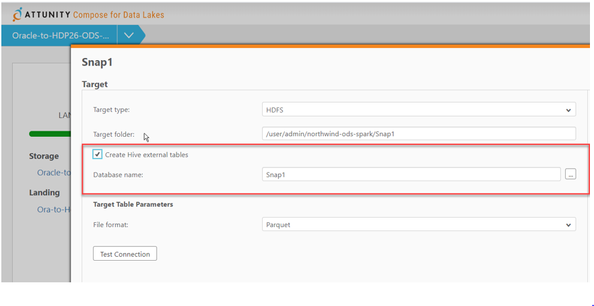
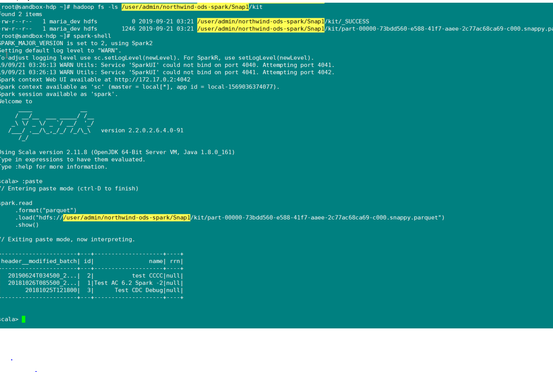
We recommend using Spark-shell to check the data in provision zone. If you want to use “Hive” client in terminal or Hive query tool in Ambari, or any other 3rd party JDBC connection tool, then you’ll need to use enable “Create Hive External Tables” in the task setting. By default, this option is not enabled.
Using “spark-shell” to query the data in provision zone:
Note: Spark-shell can be used to query all data formats including Parquet, ORC, and AVRO.
935 Views
