Unlock a world of possibilities! Login now and discover the exclusive benefits awaiting you.
- Qlik Community
- :
- Support
- :
- Support
- :
- Knowledge
- :
- Support Articles
- :
- Working with Qlik Compose for Data warehouse – QC4...
- Subscribe to RSS Feed
- Mark as New
- Mark as Read
- Bookmark
- Subscribe
- Printer Friendly Page
- Report Inappropriate Content
Working with Qlik Compose for Data warehouse – QC4DWH
- Mark as New
- Bookmark
- Subscribe
- Mute
- Subscribe to RSS Feed
- Permalink
- Report Inappropriate Content
Working with Qlik Compose for Data warehouse – QC4DWH
Feb 1, 2022 9:10:27 AM
Apr 15, 2020 1:13:56 PM
Viewing and Downloading Qlik Compose for Data Warehouses Log Files – QC4DWH: 1.1 This section describes where each of our Qlik Compose for Data Warehouse logs exists:
Qlik Compose for Data Warehouse logs are in four different locations:
- The Server logs are located under:
- <product_dir>\data\logs \ComposeForDatawarehouse.log
- <product_dir>\data\logs \Composeclient.log
- Workflow and Command task logs are found under:
- <product_dir>\data\projects\ [project_ name] \logs\etl_task\[etl_task_name].log
- <product_dir>\data\projects\ [project_ name] \logs\workflow\ [Workflow_name] \[run_id].log
- Data Warehouse and DataMart logs are found under:
- <product_dir>\java\data\projects\[project_name] \logs\ [Datamart_name].log
- Java/Agent log files are found under:
- <product_dir>\java\data\logs\compose_agent.log
Note:
- The Global SQLite file is located under:
- <product_dir>\java\data\GlobalRepository.sqlite
- The project runtime repository file is located under:
- <product_dir>\java\data\projects\[project_name]\ProjectRepoRuntime.sqlite
1.2 This section describes how to view log files from our UI:
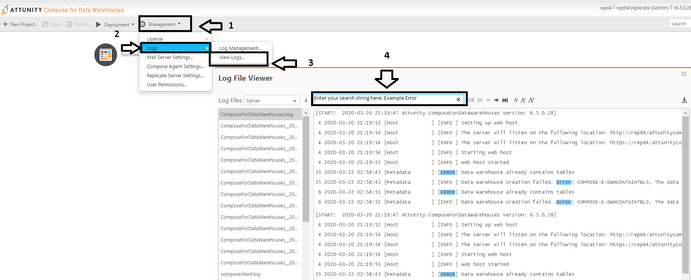
- From the Management menu, select Logs|View Logs.
- The Log File Viewer opens.
- Select the log file you want to view from the list in the Log Files pane.
- The contents of the log file will be displayed in the right pane. When you select a row in the log file, a tool-tip will display the full message of the selected row.
- Browse through the log file using the scroll bar on the right and the navigation buttons at the top of the window.
- To search for a specific string in the log file, enter the search string in the search box at the top of the window.
Note: Any terms that match the specified string will be highlighted in blue.
See below for an example:
1.3 This section describes how to download log files from our UI:
- From the Management menu, select Logs|View Logs.
- The Log File Viewer opens.
- From the list in the Log Files pane, select the log file you want to download.
- Click the Download Log File button in the top right of the window.
- The log file is downloaded.
See below for an example:
2.0 Setting up logs to verbose mode for different modules in Qlik C4DWH: 2.1 Setting up server logs to verbose mode:
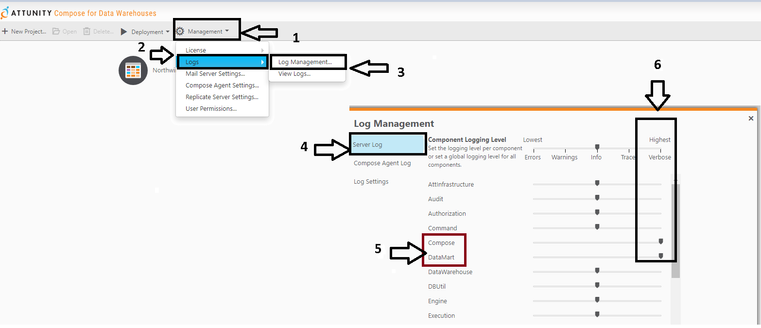
- From the Management menu, select Logs|Log Management.
- The Log Management window opens displaying the Server Log tab.
- To set Verbose mode for all the modules, move the top slider to the Verbose (Highest).
- To set Verbose mode for an individual module, select a module and then move its slider to the Verbose (Highest).
Note: In the screenshot below, the Compose and DataMart module are set to Verbose:
- Click OK to save your changes and close the Log Management dialog box.
Note: Changes to the logging level take place immediately. There is no need to restart the Qlik Compose for Data Warehouses service.
2.2 Setting up Agent log to verbose mode:
- From the Management menu, select Logs|Log Management.
- The Log Management window opens, then select Compose Agent Log
- To set a Verbose level for Agent, move its slider to Verbose (Highest) level.
- Click OK to save your changes and close the Log Management dialog box.
Note: Changes to the logging level take place immediately. There is no need to restart the Qlik Compose for Data Warehouses service.
2.3 Setting up ETL logs to Trace or Debug mode:
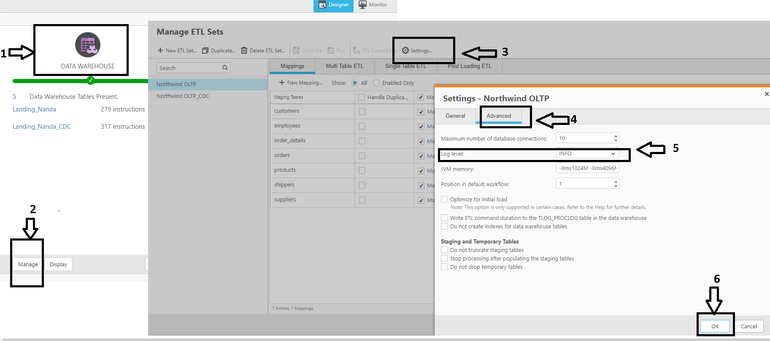
- Under the Data warehouse pane, select Manage, the Manage ETL Sets window opens, select an ETL set in the left pane and then click Settings.
- The Setting - <ETL Set Name> dialog box opens.
- In the Advanced tab, Select the log level granularity, which can be any of the following:
- INFO (default) - Logs informational messages that highlight the progress of the ETL process at a coarse-grained level.
- TRACE - Logs fine-grained informational events that can be used to debug the ETL process.
- DEBUG - Logs finer-grained informational events than the TRACE level.
Note: The log levels DEBUG and TRACE impact performance. You should only select them for troubleshooting if advised by Qlik Support team
2.4 Setting up Data Mart logs to Trace or Debug mode:
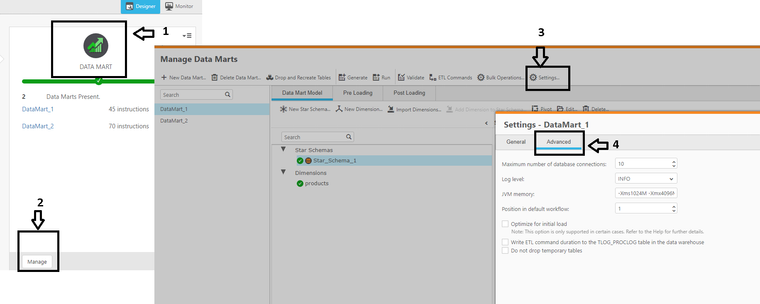
- Under the Data Mart pane, select Manage, the Manage DataMart window opens, select a DataMart set in the left pane and then click Settings.
- The Setting - <DataMart Set Name> dialog box opens.
- In the Advanced tab, Select the log level granularity, which can be any of the following:
- INFO (default) - Logs informational messages that highlight the progress of the ETL process at a coarse-grained level.
- TRACE - Logs fine-grained informational events that can be used to debug the ETL process.
- DEBUG - Logs finer-grained informational events than the TRACE level.
Note: The log levels DEBUG and TRACE impact performance. You should only select them for troubleshooting if advised by Qlik Support team
3.0 Database connections and JVM setting for Data warehouse and Datamart in Qlik C4DWH: 3.1 Setting up and calculating Database connections for Data warehouse and DataMart:
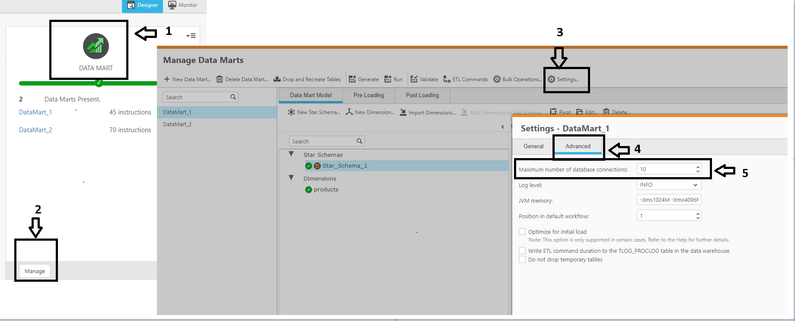
- Under Data Warehouse or Datamart pane, select Manage, the Manage Data Warehouse/DataMart window opens, select a DataMart/Data warehouse set in the left pane and then click Settings.
- The Setting - <DataMart/Data warehouse Set Name> dialog box opens
- In the Advanced tab, edit the following settings:
Maximum number of database connections: Enter the maximum number of connections allowed. The default value is 10.
Example shown below is the setting from the DataMart pane:
For more information, see below for determining the Required Number of Database Connections for Data warehouse and DataMart.
As a rule of thumb, the higher the number of database connections opened for Compose for Data Warehouses, the more tables Compose for Data Warehouses will be able to load in parallel. It is therefore recommended to open as many database connections as possible for Compose for Data Warehouses. However, if the number of database connections that can be opened for Compose for Data Warehouses is limited, you can calculate the minimum number of required connections as described below.
To determine the number of required connections:
- For each ETL set, determine the number of connections it can use during runtime. This value is specified in the Advanced tab in the data warehouse and data mart settings – see below screenshot. When determining the number of required connections, various factors need to be considered including the number of tables, the size of the tables, and the volume of data. It is therefore recommended to determine the required number of connections in a Test environment.
- Calculate the number of connections needed by all ETL tasks that run in parallel. For example, if three data mart ETL tasks run in parallel and each task requires 5 connections, then the number of required connections will be 15.
Similarly, if a workflow has two Storage Zone tasks that run in parallel and each task requires 5 connections, then the minimum number of required connections will be 10. However, if the same workflow also contains two data mart tasks (that run in parallel) and the sum of their connections is 20, then the minimum number of required connections will be 20.
3. Factor in the connections required by the Compose Console. To do this, multiply the maximum number of concurrent Compose users by three and then add to the sum of Step 2 above. So, if the number of required connections is 20 and the number of concurrent Compose users is 4, then the total would be:
20 + 12 = 32
3.1 JVM settings in Data warehouse and DataMart:
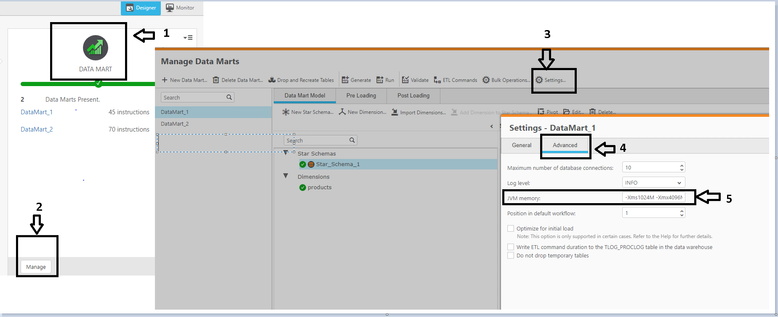
- Under Data Warehouse or Datamart pane, select Manage, the Manage Data Warehouse/DataMart window opens, select a DataMart/Data warehouse set in the left pane and then click Settings.
- The Setting - <DataMart/Data wareshouse Set Name> dialog box opens
- In the Advanced tab, edit the “JVM Memory” settings:
The default size is: -Xms1024M -Xmx4096M
Xms is the minimum memory; Xmx is the maximum memory. With the above default setting, the JVM starts running with value 1024M and can use up to value 4096M.
Example shown below is the setting from the DataMart pane:
Note: You only should edit the memory for the java virtual machine (JVM) ONLY if you experience performance issues or seeing an running out of memory error in the in the ETL log. Please contact support before making this change
- Mark as Read
- Mark as New
- Bookmark
- Permalink
- Report Inappropriate Content
When updating our logging level in the Advanced Settings of the ETL Set, the select dropdown lists the options in the following order:
-INFO
-DEBUG
-TRACE
Based on the selection order of the "Log level" dropdown, I would have expected TRACE log level to provide a finer grain log than DEBUG, but that contradicts the documentation you provided above in section 2.3.
Can you please confirm if the Order of the Log Level select dropdown options I am seeing are out of order based on log grain?
Is the DEBUG level is a finer grain log than the TRACE level as stated in your documentation above?
Currently on QC4DWH 6.5.041
Thanks!
