Do not input private or sensitive data. View Qlik Privacy & Cookie Policy.
Skip to main content

Announcements
April 13–15 - Dare to Unleash a New Professional You at Qlik Connect 2026: Register Now!
Jennell_Yorkman
Employee
Employee

In many of the demos that I have done, I have added a customizable straight table or ad-hoc report where the user can select the dimensions and measures that should appear in the chart.  This is often helpful and can replace multiple detailed straight tables in an application.  Creating the customizable chart involves simply loading the dimensions and measures that the users can pick from and then adding a straight table with conditional dimensions and expressions.


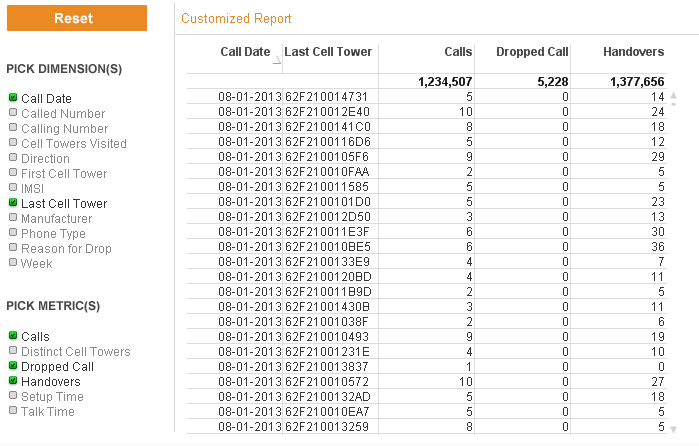
In the Call Detail Record Analysis demo a customized report was added to the application.  This is how the ad-hoc report looks with some dimensions and metrics selected.


report.png


The steps taken to build this report were:


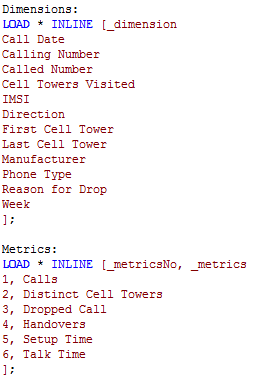
  • Load dimensions and metrics that should appear in the list box for the user to choose from.  In this example, this was done by adding two inline tables with the script below.


inline tables.png


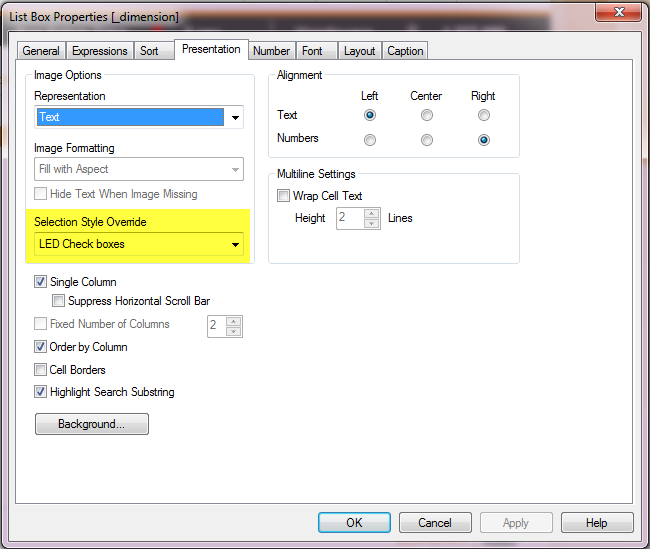
  • Then list boxes for _dimension and _metrics were added to the report sheet with the LED Check boxes selection style.


     led style.png


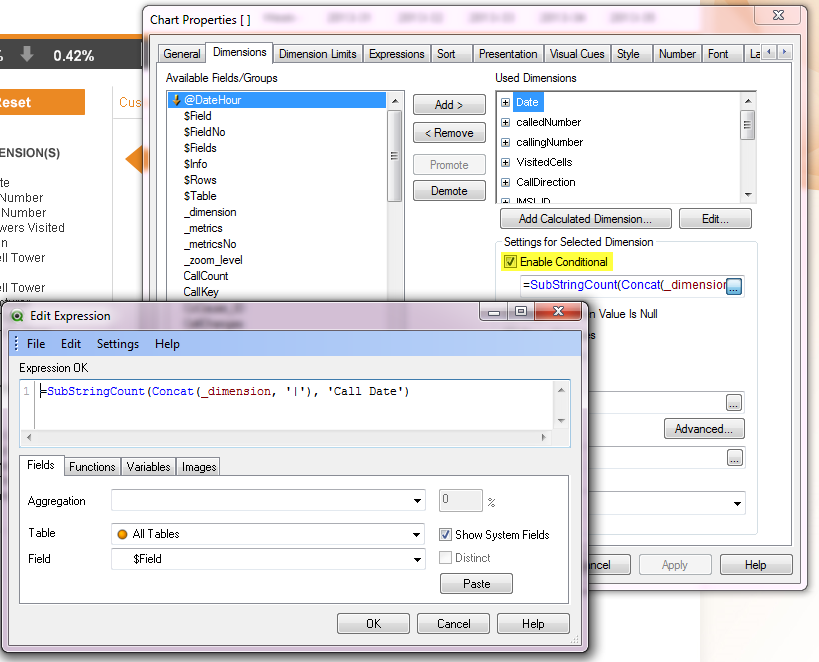
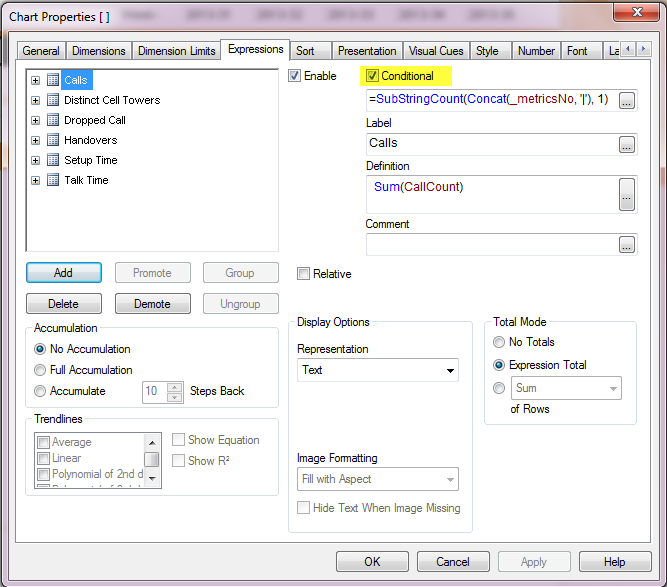
  • Next a straight table is added to the sheet with the following conditional calculation:


     calc condition.png

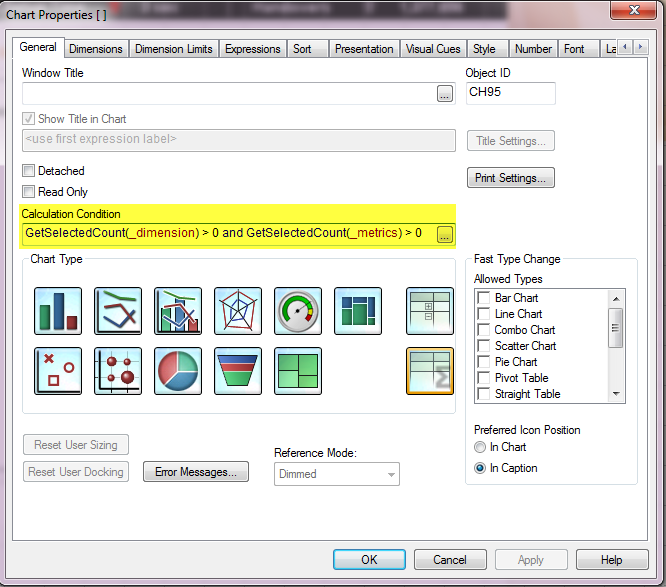
        The chart will be displayed if at least 1 dimension and 1 metric are selected from the list boxes.


  • Next the dimensions were added to the table.  Each dimension in the list box was added to the chart with a conditional expression so that the dimension is only displayed if it is selected from the Dimensions list box.

     dimensions.png


  • The same was done for each measure listed.


     expressions.png


In five easy steps, a customizable straight table or report can be added to your QlikView application providing users the ability to display a report with the data they want to see at the time.  This gives the user more flexibility and reduced the need to add detailed straight table charts to the sheets in the application.


You can read more about this topic in my Technical Brief which has more detailed step-by-step instructions.  Have fun!


Thanks,

JMC

75 Comments
jochem_zw
Employee
Employee

Did you try my suggestion?

Van: Hila Gendelman

Verzonden: woensdag 5 november 2014 15:29

Aan: Jochem Zwienenberg | Victa

Onderwerp: Re: - Customizable Straight Table

Qlik Community<http://community.qlik.com/>

Customizable Straight Table

new comment by Hila Gendelman<http://community.qlik.com/people/hilaghilagendelman?et=blogs.comment.created> - View all comments on this blog post<http://community.qlik.com/blogs/qlikviewdesignblog/2014/01/31/customizable-straight-table?et=blogs.comment.created#comment-22853>

0 Likes
898 Views
Not applicable

I actually cannot try your suggestion since I want to include the column in the Dimension calculation which I'm using:

=aggr(if(rank(   sum(Orders.Diff)   ) <= 5 , Client), Client)


I would like the Orders.Diff to be a variable that will include the first field.


Thx!

0 Likes
898 Views
Jennell_Yorkman
Employee
Employee

Hi Hila,

You can set the first selected dimension to a variable (vFirstSelected in the example below) by adding a field event trigger for the dimension field.  In the OnSelect and OnChange event you can add something like this:

=if(GetSelectedCount(_dimension)=1, _dimension, vFirstSelected)

You may need to tweak it a little because I noticed that if I select 3 dimensions and then deselect the first dimension I selected, it will still be stored in the variable.

Hope this helps.

Jennell

898 Views
Not applicable

Thanks Jennell!  I will give it a go.

0 Likes
898 Views
bharath28
Creator
Creator

Hi Jennell,

Thanks a lot for the post.

I have a small doubt:

=substringcount(concat(_dimension,'|'),'Call Date')

Instead of writing the above expression in conditional dimension/expression, why don't we use the below expression?

=min(_dimension='Call Date')

919 Views
Jennell_Yorkman
Employee
Employee

Hi Bharath,

Yes, that works as well.

Jennell

0 Likes
919 Views
robert99
Specialist III
Specialist III

Bharath Thanks for posting

The issue with =substringcount(concat(_dimension,'|'),'Call Date') is mentioned above

using net margin and target net margin (or Call Date and Date)

Then both are selected when net margin (or Date) is selected

There are work around

=SubStringCount('|' & Concat(distinct _dimension, '|') & '|', '|Call Date|')

or renaming

But=min(_dimension='Call Date') is simple (although I'm surprised it works)

Minstring also works but max doesn't? I do not understand the logic for this see edit)

Another way using count is as follows (I have been using this thanks to swuehl )

Substring Count returning multiple strings with new Conditional Dimension Functionality

Count    ({<_dimension *= {'Call Date'} >}     _dimension)

And he also gives examples in this thread (for *=)

Re: -= operator

sum( {$<Product *= {OurProduct1} >} Sales )

returns the sales for the current selection, but only for the intersection of currently selected products and the product “OurProduct1”.

edit

The reason why min(_dimension='Call Date') works is because the expression  

_dimension = Call_Num if true equals -1. If false = 0

Putting min in front leaves the result as -1 whenever Call_Num is selected by itself or with other selections. Max selects -1 when only Call_Num is selected but 0 (as 0 is > -1) when other selections are made.

0 Likes
919 Views
Anonymous
Not applicable

Hi Jason,

I went through your post and it is awesome.

I am new to QlikView and it really helped me.

I have a question here..

1) Lets say if my report has  20 charts, do I need to create 20 sets of dimensions and metrics? Is there any way to avoid that.

My requirement is to have customizable charts with dynamic dimensions and expressions which would give users an option to choose from the list. Please let me know if there is a way to avoid creating the dimension and metric islands as many as the number of charts.

Any response would be highly appreciated.....

Thanks

Heera.

0 Likes
919 Views
cbaqir
Specialist II
Specialist II

Is there a limit to the number of dimensions the Quickchart.xlsx can contain? If I have more than 20, I don't see the additional dimensions.

0 Likes
919 Views
mayankraoka
Specialist
Specialist

Hi All,

The post was awesome and I have used this in my app.I am facing one issue of scroll bar in the browser instead of table.The dimension selector has more that 50 dimensions.When we select more number of dimensions for e.x.
>15 scroll bar appears and that too in Browser.Which is not good we want the scroll bar in straight table itself.

Can anyone help me on this?

Regards,

Mayank

0 Likes
919 Views