Unlock a world of possibilities! Login now and discover the exclusive benefits awaiting you.
- Subscribe to RSS Feed
- Mark as New
- Mark as Read
- Bookmark
- Subscribe
- Printer Friendly Page
- Report Inappropriate Content
@What does the TOTAL qualifier do when used in a chart expression? I have used TOTAL in an expression when I want to perform an aggregation across all dimensions. For instance, if I need to show the percentage of employees in a specific office in a KPI object, I would use the TOTAL qualifier in an expression like this:


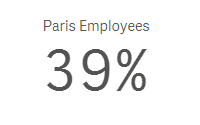
I would sum the number of employees in the Paris office and divide that by the total number of employees across all offices. In this expression, TOTAL disregards the dimension value (which is City in this case) and adds all employees. Now if I make a selection in my app and select Paris, then my KPI would change to 100% because the total is based on the possible field values. To get around this, I can add set analysis to the expression to look at the data before any selections were made. The expression would look like the expression below and would remain 39% even if city selections are made.

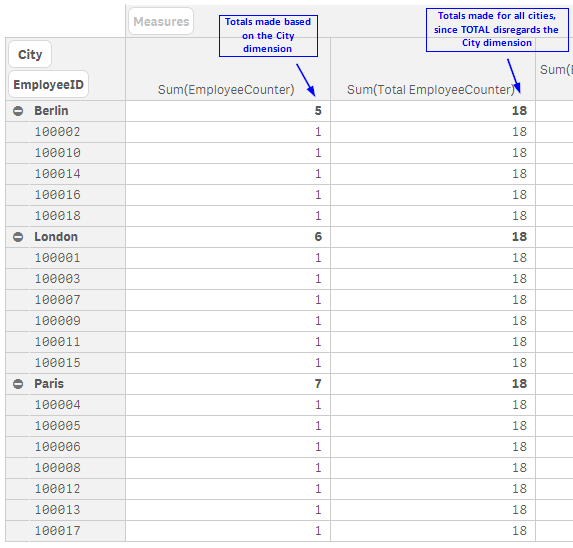
I often use the TOTAL qualifier in KPI objects when I need to highlight a value but it can be used in any chart expression. In the pivot table below, you can see how an expression value can differ with the use of TOTAL.

The TOTAL qualifier is useful when you want to see the shares of something similar to when you use a pie chart to see the percentage of parts that make up the whole. In my case, it is helpful when I want to see the shares without making a selection first. Henric Cronstrom wrote a great blog on The Aggregation Scope which talks about this topic is more detail.
Thanks,
Jennell
- « Previous
-
- 1
- 2
- Next »
You must be a registered user to add a comment. If you've already registered, sign in. Otherwise, register and sign in.