Unlock a world of possibilities! Login now and discover the exclusive benefits awaiting you.
- Qlik Community
- :
- Support
- :
- Support
- :
- Knowledge
- :
- Member Articles
- :
- Calculating rolling n-period totals, averages or o...
- Edit Document
- Move Document
- Delete Document
- Subscribe to RSS Feed
- Mark as New
- Mark as Read
- Bookmark
- Subscribe
- Printer Friendly Page
- Report Inappropriate Content
Calculating rolling n-period totals, averages or other aggregations
- Move Document
- Delete Document and Replies
- Mark as New
- Bookmark
- Subscribe
- Mute
- Subscribe to RSS Feed
- Permalink
- Report Inappropriate Content
Calculating rolling n-period totals, averages or other aggregations
Nov 30, 2022 9:45:07 AM
May 4, 2013 3:53:31 PM
A question that gets asked regularly is how to calculate a rolling measure over a period of N-months (or weeks or days). For example a 12-month rolling total or a 4-week rolling average. There are several ways to do this. But these approaches have some limitations that need to be kept in mind. I'll try to explain these approaches and some of their limitations.
- Accumulation
- RangeXXX functions
- Set analysis
- AsOf tables
First let's load some sample data. The SalesData table below will contain sales amount values for twelve consecutive months.
SalesData:
load * inline [
Month, Amount
1,6
2,4
3,7
4,3
5,4
6,9
7,5
8,7
9,8
10,6
11,9
12,7
];
This is a very simple table with little data, but this enough for demonstration purposes.
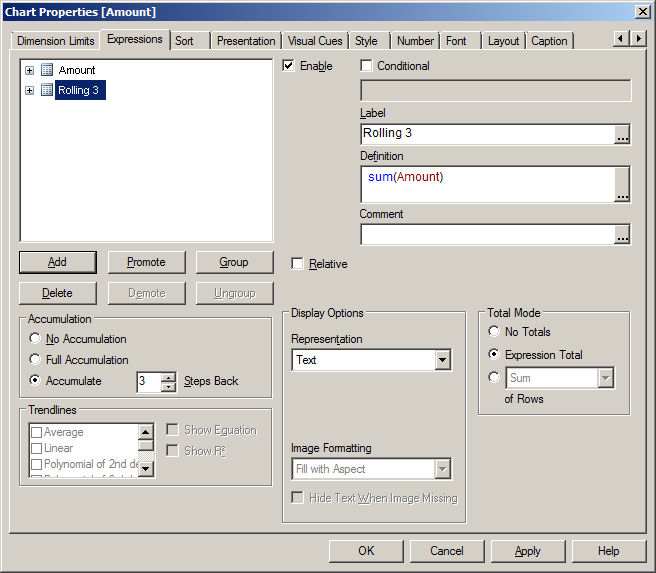
Once this data is loaded it's possible to create a straight table chart object to display the amount per month and a running total. As expected Month is used as dimension. The expression sum(Amount) will display the amount per month. Now let's add an expression to calculate a running total over three month periods.
This can be done in two ways. The first uses the Accumulation option for expressions. The same expression sum(Amount) is used, but now the Accumulation option is set to 3 Steps Back:
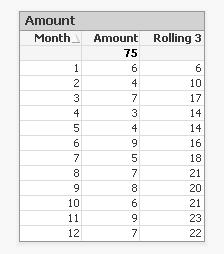
The second option uses the rangesum function. That expression looks like this:
rangesum(above(sum(Amount),0,3))
This sums the Amount value on current row and on the previous two rows. The resulting straight table looks like this:
This looks good. The rolling 3 months amount is calculated correctly. But what happens if a selection of months is made?
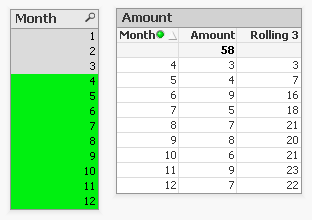
The rolling 3 month amount for month 4 is now 3 instead of 14. This is because month 1,2 and 3 are no longer included in the calculation for the rolling 3 month total.
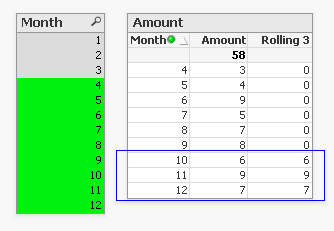
The accumulation option has another issue. It only works when only one dimension is used in the straight table. The rangesum expression can be modified so it can calculate across dimension borders, but the accumulation option can't. The modified rangesum expression adds the total keyword to the above() function:
rangesum(above(total sum(Amount),0,3))
This goes some way to doing what we want, but the issue of displaying the wrong rolling 3 month amount for month 4 isn't solved yet. Contrary to what I first thought there is a solution for this, as Henric pointed out to me in the comments below. By combining the rangesum with the aggr function it's possible to calculate the correct rolling 3 month amounts for each month. The expression needed for that looks like this:
sum(aggr(rangesum(above(total sum({<Month=>}Amount),0,3)),Month))
Read Elif's blog post Accumulative Sums for a more complete explanation.
How about set analysis expressions?
This expression should calculate the sum of amount for the three month period:
sum({<Month={'>=$(=only(Month)-2)<=$(=only(Month))'}>}Amount)
But notice the only() function. This requires that only one month value is selected. After selecting month 4 the result looks like this:

This shows the selected month, but also the two previous months. And the values are not accumulated.
Ok, but what about the max function instead of only?
sum({<Month={'>=$(=max(Month)-2)<=$(=max(Month))'}>}Amount)
That gives a different result, but still not what we're looking for:
Now only the last three months are shown and again the values are not accumulated.
The 'problem' is that the set is calculated once for the entire chart, not per row. This means that it's not possible here to use Month both as a dimension and in the set modifier in the expression.
There's still an option left to discuss: AsOf tables.
The AsOf table links a period with all the periods in the rolling period. In this example months are used, but it can be applied to any type of period like hours, days or weeks.
For the three month periods needed for a rolling 3 month total this means a month should be linked to itself, the previous month and the month before the previous month. The only exceptions are the first month, which is itself the rolling 3 month period, and the second month that together with the first month is its rolling 3 month period. There are no months before the first month so the first two months cannot run over 3 months.
The AsOf table needed for the rolling 3 month calculations looks like this:
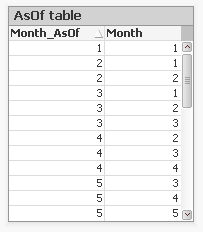
This table can be created like this:
AsOfMonth:
load
Month as Month_AsOf,
Month + 1 - IterNo() as Month
Resident SalesData
while IterNo() <= 3;
right join load Month Resident SalesData;
What this does is create three records for every month using the while statement. But that also creates three records for month 1 and 2. This would create a month 0 and a month -1. The right join is used to remove those incorrect month values.
Now that the AsOfMonth table is created the Month_AsOf field can be used instead of the Month field in the straight table. The expression for the straigh table is simply sum(Amount).
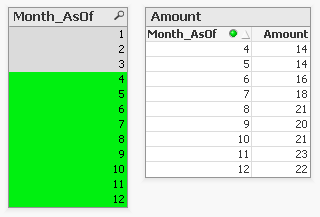
The straight table now shows the correct rolling 3 month total for month 4.
This can be expanded a little so not only the rolling 3 month can be shown, but also the amount for the month itself. To achieve this the AsOf table is modified by adding a field to label the type of period. And records are added to the table so each Month_AsOf value is linked to the matching Month value:
AsOfMonth:
load 'Current' as Type,
Month as Month_AsOf,
Month as Month
Resident SalesData;
Concatenate (AsOfMonth)
load 'Rolling 3' as Type,
Month as Month_AsOf,
Month + 1 - IterNo() as Month
Resident SalesData
while IterNo() <= 3;
right join load Month Resident SalesData;
There are now two types of periods available: Current and Rolling 3. Additional period types can be added for example for Rolling 6, Rolling 12 month and Year-to-Date periods. You can find examples of these types in the attached AsOf Table Examples.qvw document.
The period type can be used in the chart expressions to calculate the amount for the wanted period:
Current amount: sum({<Type={'Current'}>}Amount)
Rolling 3 month amount: sum({<Type={'Rolling 3'}>}Amount)
Concluding, there are two solutions that do what we want:
1. The rangesum-aggr combination
2. The AsOf table
The first has the advantage that no changes to the data model are needed. It's also possible to dynamically change the period to aggregate over by using a variable instead of a hardcoded number of periods. A disadvantage is that that it's a somewhat complicated expression that also comes with a performance cost.
The AsOf needs changes in the data model to create the AsOf table and fill it with the necessary records. The advantage is that it likely performs better on large data sets. It's also quite versatile since you can add several sets of records to meet different scenario's. The expressions you end up with in the charts are also less complicated. That said, it will likely take you some time to fully understand the AsOf table concept and realize all the places where you can put it to good use.
In the end you'll have to decide for yourself which solution is appropriate in your situation. With regards to the performance of one or the other solution, you will simply have to test to discover if the performance is acceptable. But of course such testing is already part of your development process, right?
I'd like to thank John Witherspoon for introducing me to the AsOf tables concept and Henric for pointing out the solution using the rangesum function in combination with the aggr function.
- Move Comment
- Delete Comment
- Mark as Read
- Mark as New
- Bookmark
- Permalink
- Report Inappropriate Content
Good post! It covers a number of different methods well.
But there is an additional way to solve this problem - and that is to combine the RangeSum(Above()) with the Aggr() function, e.g.
sum( aggr( rangesum( above( sum(Sales),0,12) ),Month))
Then each row (or bar or slice) will be a sum over different "rows" defined in the Aggr() function. See more on Accumulative Sums
HIC
- Move Comment
- Delete Comment
- Mark as Read
- Mark as New
- Bookmark
- Permalink
- Report Inappropriate Content
Thanks!
And whoa, I totally missed that one. A belated aha-erlebnis. 
Thanks for mentioning that solution. I remember seeing Elif's post but it probably went right over my head back in October.
- Move Comment
- Delete Comment
- Mark as Read
- Mark as New
- Bookmark
- Permalink
- Report Inappropriate Content
This is very helpful.
One question on the AsOf table - if you were do calculations that did not involve rolling amounts, would you have problems with data being duplicated to create the additional rows?
- Move Comment
- Delete Comment
- Mark as Read
- Mark as New
- Bookmark
- Permalink
- Report Inappropriate Content
The typical usage would be that you have a field from the AsOf table as dimension and Sum(Amount) as expression. Then the Amount will be summed in the transaction table - where this field resides.
Which means that the same dollar will be counted in several different months, but the totals will still be correct.
HIC
- Move Comment
- Delete Comment
- Mark as Read
- Mark as New
- Bookmark
- Permalink
- Report Inappropriate Content
Hi Gyssbert/Henric,
Could you please help in providing some examples in the above QVW, in including some other dimensions like Product? Just wanted to know the logic of other dimensions being used with the above mentioned logic.
Please share example in QVW.
Thanks!!!
- Move Comment
- Delete Comment
- Mark as Read
- Mark as New
- Bookmark
- Permalink
- Report Inappropriate Content
The AsOf Table Examples document has more dimensions. As long as the AsOf table is linked to the fact table on the date (or in the example on Period1 month field) your fact table can have any number of dimensions, either directly as fields in the fact table or in tables linked to the fact table by key fields.
- Move Comment
- Delete Comment
- Mark as Read
- Mark as New
- Bookmark
- Permalink
- Report Inappropriate Content
Hi Gysbert...
Many Thanks..This QVW and this post helped a lot in achieving my targets. Learnt a new logic as well.
Looking forward for more concepts and supports. Thanks again.
Regards!!!
- Move Comment
- Delete Comment
- Mark as Read
- Mark as New
- Bookmark
- Permalink
- Report Inappropriate Content
Excellent post. I finally found, thanks to this post, what I was looking for : how to get a simple moving total, year to date or a comparison versus previous year.
Thanks a lot.
- Move Comment
- Delete Comment
- Mark as Read
- Mark as New
- Bookmark
- Permalink
- Report Inappropriate Content
Excellent post Gysbert! Thanks!
-Rob
- Move Comment
- Delete Comment
- Mark as Read
- Mark as New
- Bookmark
- Permalink
- Report Inappropriate Content
Very Useful post with step by step move on application...