Unlock a world of possibilities! Login now and discover the exclusive benefits awaiting you.
- Qlik Community
- :
- Forums
- :
- Analytics
- :
- QlikView
- :
- Documents
- :
- Chord diagram
- Subscribe to RSS Feed
- Mark as New
- Mark as Read
- Bookmark
- Subscribe
- Printer Friendly Page
- Report Inappropriate Content
Chord diagram
- Mark as New
- Bookmark
- Subscribe
- Mute
- Subscribe to RSS Feed
- Permalink
- Report Inappropriate Content
Chord diagram
Hi community,
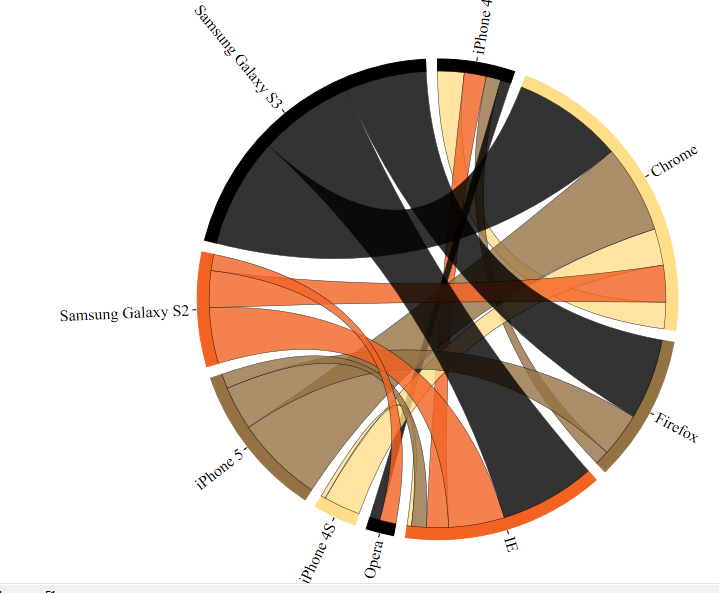
I've created a Chord Diagram as extension object that I'd like to share.
It's looks like this:
You can find the .qar file and the qvw example in my blog post.
I hope you like it.
Thanks,
JV
- Mark as Read
- Mark as New
- Bookmark
- Permalink
- Report Inappropriate Content
Hi,
Wondering, is there any user license or copyright related information for using Qlik Extension objects?
Thanks,
- Mark as Read
- Mark as New
- Bookmark
- Permalink
- Report Inappropriate Content
Hello vinay,
This extension object is distributed under the MIT licence (The MIT License (MIT) | Open Source Initiative) although I forgot to include it. I'll be updating the download link.
Feel free to use this extension and modify is if you need so.
Best,
JV
- Mark as Read
- Mark as New
- Bookmark
- Permalink
- Report Inappropriate Content
Thanks a lot!!
- Mark as Read
- Mark as New
- Bookmark
- Permalink
- Report Inappropriate Content
Hi there, I am pretty new to QV extensions and I can't figure out how to install this chord one.
I clicked on the qar archive, QlikView started up and I message appeared confirming the successful installation; I then copied the d3 folder found under
C:\Users\<myuser>\AppData\Local\QlikTech\QlikView\Extensions
to
C:\ProgramData\QlikTech\QlikViewServer\Extensions\Objects
as I did before for another extension, but I am still not able to see this extension in the Document Properties under the Extensions tab.
What's wrong?
Thanks in advance.
- Mark as Read
- Mark as New
- Bookmark
- Permalink
- Report Inappropriate Content
Hi Alberto, I believe you are referring to Document extensions, but the Chord diagram is a extension object. You need to add it in webview by right click -> New Sheet Object -> Extension Objects.
I hope this helps.
Juan
- Mark as Read
- Mark as New
- Bookmark
- Permalink
- Report Inappropriate Content
Hi,
Is it possible to change the colors based on certain values of the dimensio. For e.g The dimension that i have to show in the chord chart are test type and Result and the measure is count of result. Result can be either Pass, fail or dropped. Can I show the Pass cases in green and failed ones in red?
Regards,
Greeshma
- Mark as Read
- Mark as New
- Bookmark
- Permalink
- Report Inappropriate Content
Hi guys. Chord diagram works incorrect, placement of connections is wrong. Screenshot made without any selections.

Also, when one category is selected, point displayed in wrong place

Any suggestions how to fix it? Already spent few hours, still no clue 🙂