I recently finished a test of data integration of Qlikview and R. I used data from Indian Water Quality project at Kaggle to develop a prototype for plotting a heatmap upon setting a filter in Qlikview dashboard. Thanks to Brian Bauer (bbu) for his post QlikView and R Integration for Predictive Analytics Example the which I used as reference for this development.
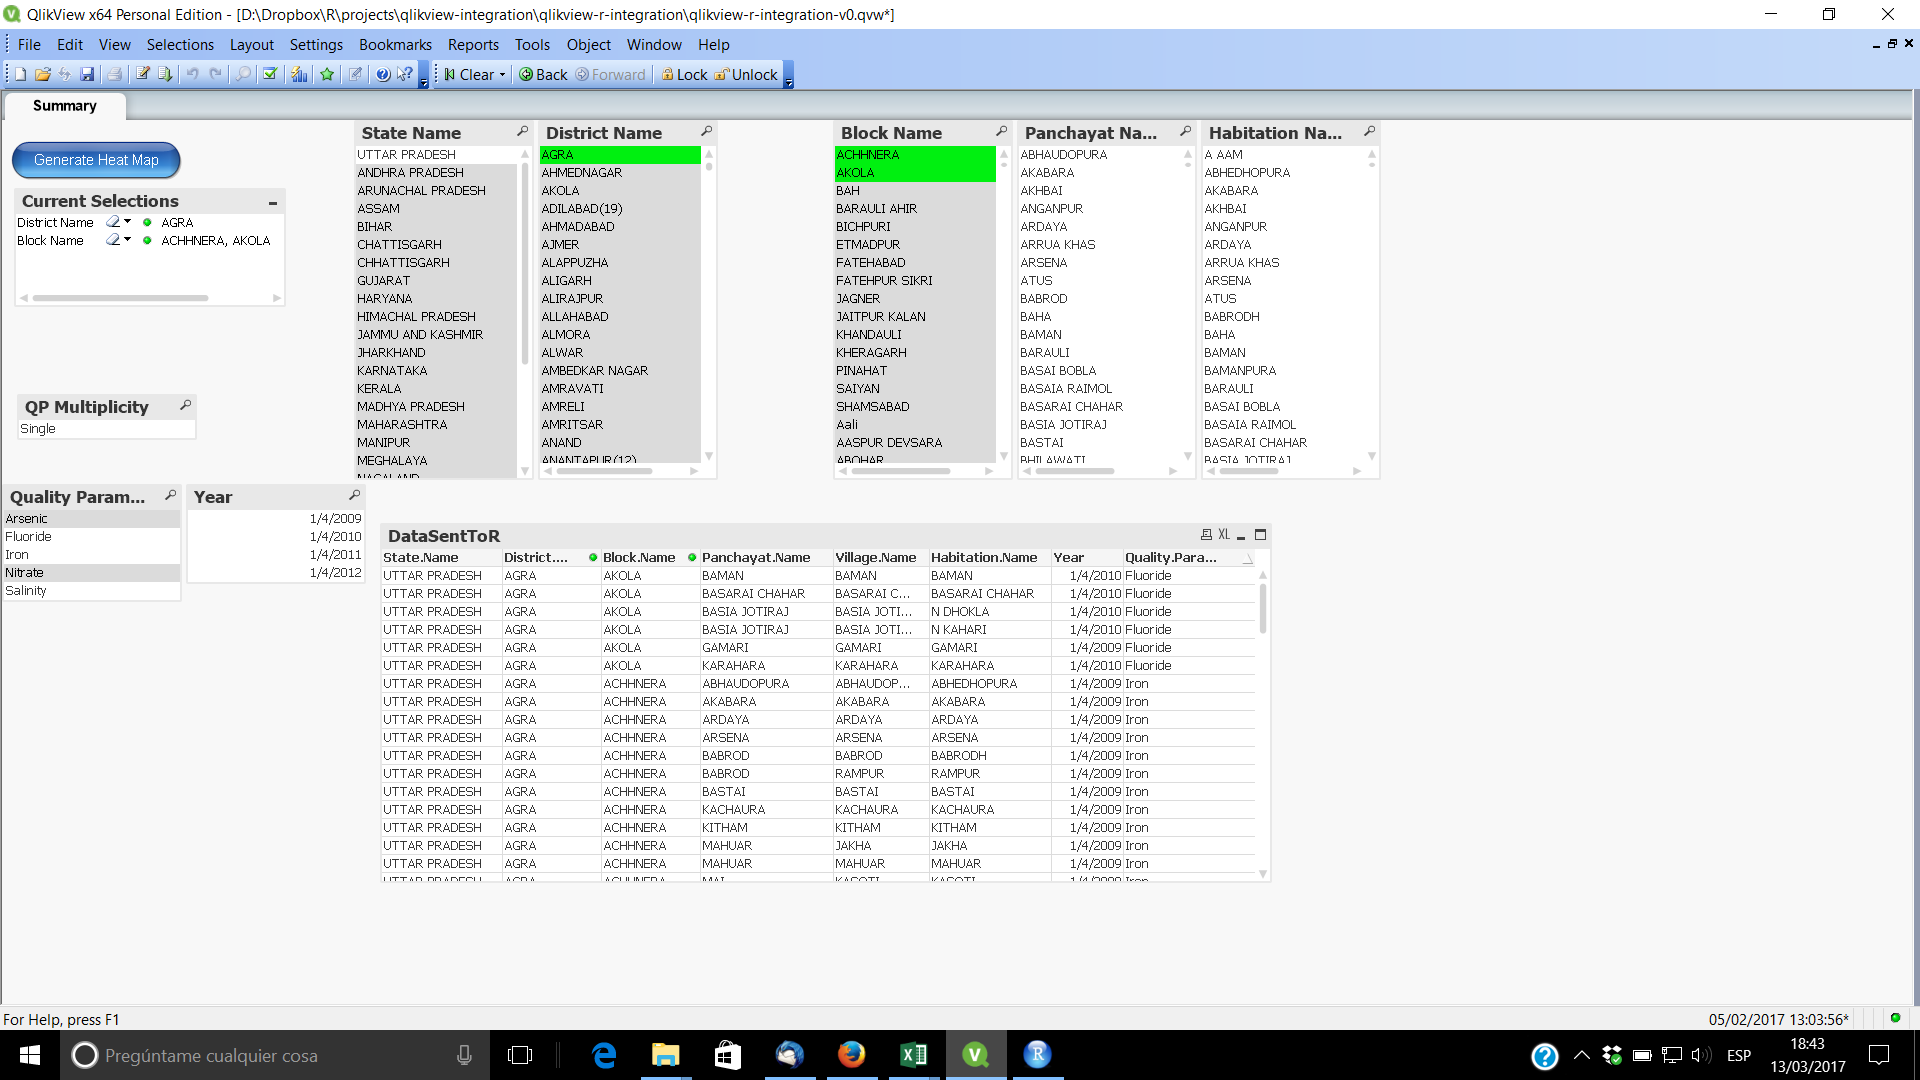
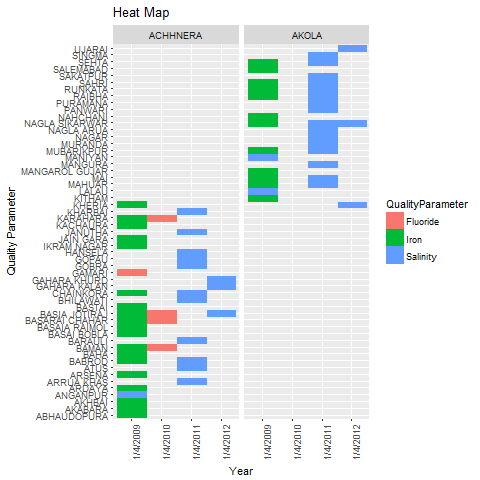
Upon clicking on the button "Generate Heat Map" a VB script is executed to initiate a session in R and plot a heatmap using ggplot library.
The procedure followed to generate such a graph was
- 1.- Export data from Qlikview to a CSV text file
- 2.- Declare and initialise a R session using library StatconnDcom
- 3.- Prepare data using a R function sourced from Github
- 4.- Plot the heatmap using function draw_hm, that call in turn ggplot function, into a png file
Below you can see the VB script used for this purpose. Enjoy!
Sub plotHeatmap
' Export the selected patient data to be scored.
Set myTable = ActiveDocument.GetSheetObject("DataSentToR")
myTable.Export (CurrentPath & "/data/ExportFile.csv"), ";"
' Create a COM object representing R
Set R = CreateObject("StatConnectorSrv.StatConnector")
R.Init "R"
R.EvaluateNoReturn "library(rattle)"
R.EvaluateNoReturn "library(devtools)"
R.EvaluateNoReturn "library(ggplot2)"
R.EvaluateNoReturn "setwd(" & "'indian-water-quality'" & ")"
CurrentPathWindows = Replace(CurrentPath, "/", "\\")
R.EvaluateNoReturn "crs$water.quality1<-read.csv(file=" & "'" & CurrentPathWindows & "\\data\\ExportFile.csv" & "'" & ",sep=';'" & ")"
R.EvaluateNoReturn "saveRDS(crs$water.quality1, file = 'water.quality1.rds')"
R.EvaluateNoReturn "names(crs$water.quality1)<-c( 'StateName','DistrictName','BlockName','PanchayatName','VillageName','HabitationName','Year','QualityParameter')"
' source("water-quality-data-preparation-v3.R")
R.EvaluateNoReturn "source('https://github.com/rventuradiaz/indian-water-quality/raw/master/water-quality-data-preparation-v4.R')"
R.EvaluateNoReturn "wq_df <-wq1_df(crs$water.quality1)"
R.EvaluateNoReturn "png('Rplot_Panchayat_ggplot.png')"
R.EvaluateNoReturn "plothm <- draw_hm(data=wq_df, x=wq_df$Year, y=wq_df$PanchayatName, fillInput = wq_df$QualityParameter, facetInput = . ~ BlockName, fill_discrete='QualityParameter')"
R.EvaluateNoReturn "print(plothm)"
R.EvaluateNoReturn "dev.off()"
' Close R connection
R.close
End Sub