Unlock a world of possibilities! Login now and discover the exclusive benefits awaiting you.
- Qlik Community
- :
- Support
- :
- Support
- :
- Knowledge
- :
- Member Articles
- :
- Missing Manual - ValueLoop() & ValueList()
- Edit Document
- Move Document
- Delete Document
- Subscribe to RSS Feed
- Mark as New
- Mark as Read
- Bookmark
- Subscribe
- Printer Friendly Page
- Report Inappropriate Content
Missing Manual - ValueLoop() & ValueList()
- Move Document
- Delete Document and Replies
- Mark as New
- Bookmark
- Subscribe
- Mute
- Subscribe to RSS Feed
- Permalink
- Report Inappropriate Content
Missing Manual - ValueLoop() & ValueList()
![]()
Have you ever wondered how the examples from the Qlikview help may look like?
Please see below and enjoy responsibly...
Valueloop() & VaueList()
Both of those functions belong to Synthetic Dimension Functions.
Synthetic Dimension is a type of Calculated Dimension
- the difference between "standard" Calculated Dimension and Synthetic one is that
the standard dimensions are based on values from existing fields
whereas for Synthetic Dimensions those values are created "on the fly".
The drawback here is that you can not mix standard dimensions with synthetic in the way you would expect.
(please see "Practical use").
ValueLoop()
Used:
Back End -No
Front End - Yes

Description(Qlikview Help)
Returns a set of iterated values which, when used in a calculated dimension, will form a synthetic dimension.
The values generated will start with the from value and end with the to value including intermediate values in increments of step. In charts with a synthetic dimension created with the valueloop function it is possible to reference the dimension value corresponding to a specific expression cell by restating the valuloop function with the same parameters in the chart expression. The function may of course be used anywhere in the layout, but apart from when used for synthetic dimensions it will only be meaningful inside an aggregation function
![]()
Create series of numbers in a range given by criteria.
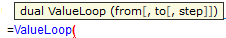
from - first value
to - last value
step - intermediate values criteria.
When step is missing 1 is assumed
Qlikview help examples are very straightforwards and easy to understand:
| Example 1 | Example 2 | Example 3 |
|---|---|---|
valueloop ( 1, 3 ) From 1 to 3, (step is omitted so 1 is assumed): | valueloop ( 1, 5, 2 ) From 1 to 5, step 2: 1,1+2=3,3+2=5 | valueloop ( 11 ) returns the value 11 |
![2015-08-25 07_56_30-QlikView Personal Edition - [QV1].png](/legacyfs/online/96879_2015-08-25 07_56_30-QlikView Personal Edition - [QV1].png) | ![2015-08-25 07_58_37-QlikView Personal Edition - [QV1].png](/legacyfs/online/96880_2015-08-25 07_58_37-QlikView Personal Edition - [QV1].png) | ![2015-08-25 07_59_56-QlikView Personal Edition - [QV1].png](/legacyfs/online/96881_2015-08-25 07_59_56-QlikView Personal Edition - [QV1].png) |
Practical use
Example 1
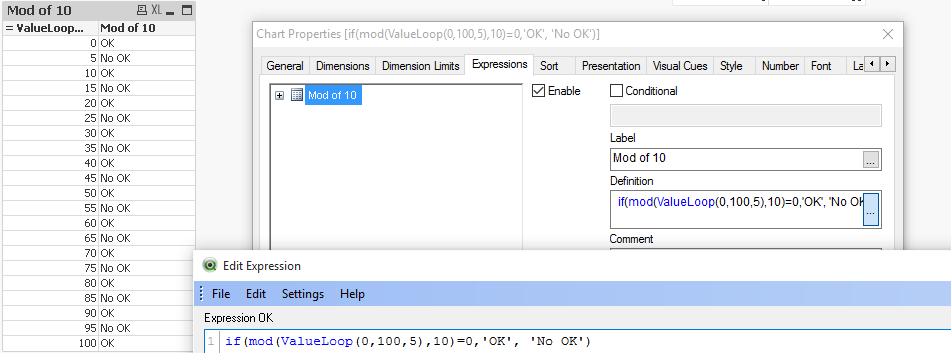
If you need to provide calculations to check if the MOD of values from 0 to 100 with step 5 is divided by 10 without remainder
Create Dimension: ValueLoop(0,100,5)
and Expression: if(mod(ValueLoop(0,100,5),10)=0,'OK', 'No OK')
See also:
How to create a Square Pie Chart
or
qlikfreak.wordpress.com/2014/06/17/infographics-in-qlikview-vol-2/
ValueList()
Used:
Back End -No
Front End - Yes

Description(Qlikview Help)
Returns a set of listed values which, when used in a calculated dimension,
will form a synthetic dimension. In charts with a synthetic dimension created with the valuelist function it is possible to reference the dimension value corresponding to a specific expression cell by restating the valuelist function with the same parameters in the chart expression. The function may of course be used anywhere in the layout, but apart from when used for synthetic dimensions it will only be meaningful inside an aggregation function
![]()
Create series of values from given list
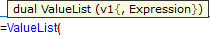
v1 - list of values
Again, both of those examples are very easy to understand:
| Header 1 | Header 2 |
|---|---|
| valuelist ( 1, 10, 100 ) |  &am... _ Qlik Community.png) |
| Header 1 | Header 2 |
|---|---|
| valuelist ( 'a', 'xyz', 55 ) |  &am... _ Qlik Community.png) |
Practical use
Data Model
LOAD Date,
Year(Date) as Year,
Values
inline [
Date, Values
01/01/2009, 1
11/04/2009, 2
20/07/2009, 2
28/10/2009, 2
05/02/2010, 2
16/05/2010, 2
24/08/2010, 1
02/12/2010, 1
]
The usual way of creating straight table is be to add Year as Dimension and sum(Values) as expression.
This will return value for each Year.
![2015-08-25 00_38_57-QlikView Personal Edition - [C__Users_Katarzyna_Desktop_Files_vpl.qvw_].png](/legacyfs/online/96861_2015-08-25 00_38_57-QlikView Personal Edition - [C__Users_Katarzyna_Desktop_Files_vpl.qvw_].png)
But if we want o use Synthetic Dimension in the same way this will return only one Total value for both years.
![2015-08-25 00_47_25-Chart Properties [Sum(Values)].png](/legacyfs/online/96862_2015-08-25 00_47_25-Chart Properties [Sum(Values)].png)
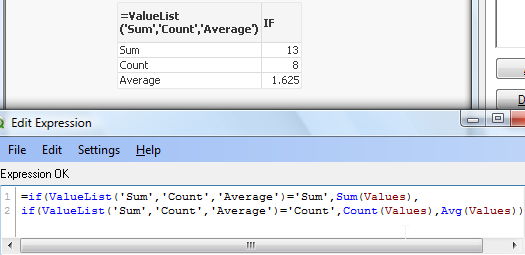
One of the way to use this function is to create list (similar to Statistics Box) with your own KPI's:
![2015-08-25 23_10_09-Chart Properties [1.625].png](/legacyfs/online/96974_2015-08-25 23_10_09-Chart Properties [1.625].png)
and then use nested IF statement to create your Metrics
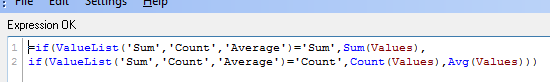
=if(ValueList('Sum','Count','Average')='Sum',Sum(Values),
if(ValueList('Sum','Count','Average')='Count',Count(Values),Avg(Values)))
to get below result:
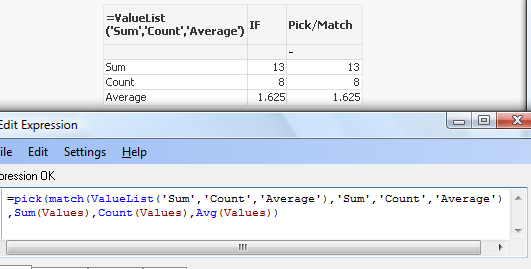
As nesting IF's can be tricky and cumbersome beyond 2 or 3 criteria we can use Pick/Match functions to improve our calculations:
=pick(match(ValueList('Sum','Count','Average'),'Sum','Count','Average')
,Sum(Values),Count(Values),Avg(Values))
Conclusion:
Although both of those function are not very often used
(they did not make to final 30 of rwunderlich survey
you can find a practical way of using them.
Feeling Qlikngry?
- Move Comment
- Delete Comment
- Mark as Read
- Mark as New
- Bookmark
- Permalink
- Report Inappropriate Content
Thanks for sharing! Interesting article, finally clarifying some of my questions regarding ValueList()!
- Move Comment
- Delete Comment
- Mark as Read
- Mark as New
- Bookmark
- Permalink
- Report Inappropriate Content
I used this in my dimension to get a list of all the dimensions
=ValueList( $(=Concat(chr(39)& $Field & chr(39) , ', ' )) )
Would it be possible to make a second dimension with the values of these dimensions?
Then it would be possible to count the number of records you have for each value. This opens possibilities to compare groups in different states.
- Move Comment
- Delete Comment
- Mark as Read
- Mark as New
- Bookmark
- Permalink
- Report Inappropriate Content
Nice post 
- Move Comment
- Delete Comment
- Mark as Read
- Mark as New
- Bookmark
- Permalink
- Report Inappropriate Content
Very good.
- Move Comment
- Delete Comment
- Mark as Read
- Mark as New
- Bookmark
- Permalink
- Report Inappropriate Content
Muy buen aporte.
Por fin he entendido ValueList() y ValueLoop()
- Move Comment
- Delete Comment
- Mark as Read
- Mark as New
- Bookmark
- Permalink
- Report Inappropriate Content
De nada. Feliz de ayudar.
- Move Comment
- Delete Comment
- Mark as Read
- Mark as New
- Bookmark
- Permalink
- Report Inappropriate Content
Thanks for sharing