Unlock a world of possibilities! Login now and discover the exclusive benefits awaiting you.
- Qlik Community
- :
- Forums
- :
- Groups
- :
- Industry and Topics
- :
- Healthcare
- :
- Is a BoxPlot/Line combo chart possible?
- Subscribe to RSS Feed
- Mark Topic as New
- Mark Topic as Read
- Float this Topic for Current User
- Bookmark
- Subscribe
- Mute
- Printer Friendly Page
- Feature this Topic
- Mark as New
- Bookmark
- Subscribe
- Mute
- Subscribe to RSS Feed
- Permalink
- Report Inappropriate Content
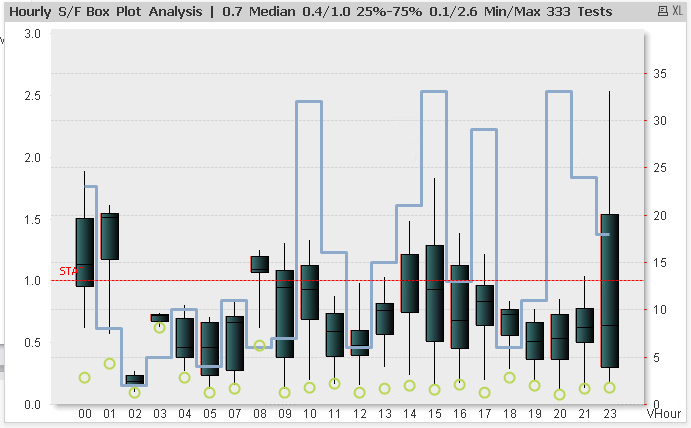
Is a BoxPlot/Line combo chart possible?
I have the boxplot chart below that analyzes hourly duration of a procedure over a 24 hour period.
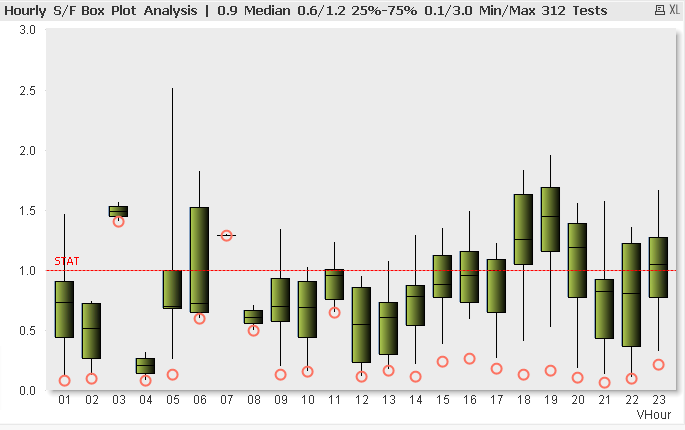
I was hoping to combine this with hourly procedures by adding the expression count(ID). When I go to the “Axes” tab and move the Count(ID) expression over to the right to form the 2nd axis I do not get the results experienced with previous combo charts. (Last chart below.)

Message was edited by: Richard Ouellette added 11:37 AM 2/16
- Tags:
- Group_Discussions
Accepted Solutions
- Mark as New
- Bookmark
- Subscribe
- Mute
- Subscribe to RSS Feed
- Permalink
- Report Inappropriate Content
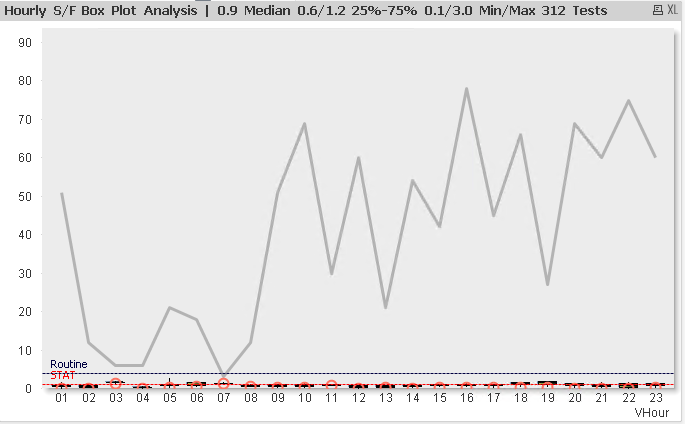
Something like this ? 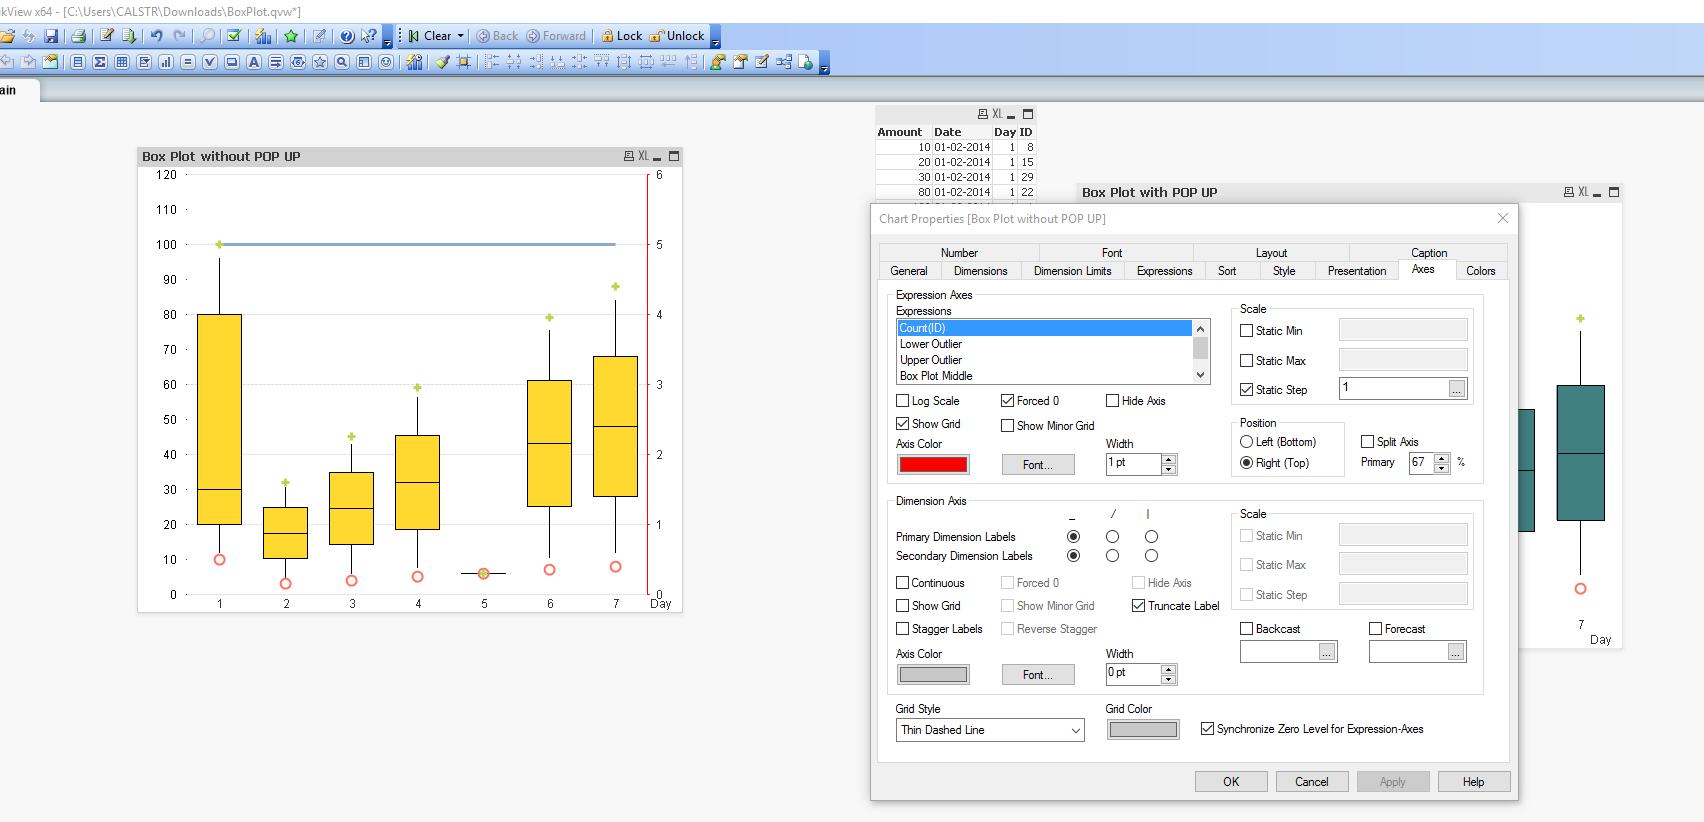
- Mark as New
- Bookmark
- Subscribe
- Mute
- Subscribe to RSS Feed
- Permalink
- Report Inappropriate Content
Hi Richard ,
Could you share the application ?
- Mark as New
- Bookmark
- Subscribe
- Mute
- Subscribe to RSS Feed
- Permalink
- Report Inappropriate Content
Steeven
Thanks for your offer to take a look. I can't share the actual application but did upload and example for you to take a look called boxplot.qvw
Rick
- Mark as New
- Bookmark
- Subscribe
- Mute
- Subscribe to RSS Feed
- Permalink
- Report Inappropriate Content
Something like this ?
- Mark as New
- Bookmark
- Subscribe
- Mute
- Subscribe to RSS Feed
- Permalink
- Report Inappropriate Content
Steeven
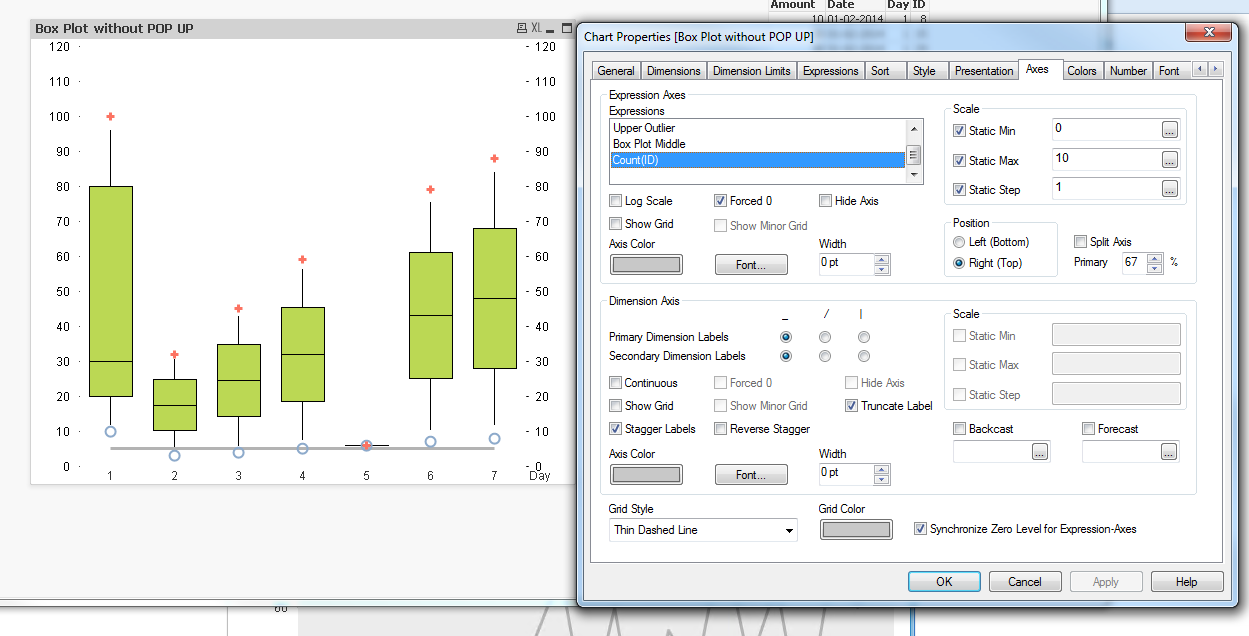
That did the trick!! It looks like I needed to promote the count expression to the top in order to get the axes to work. Thank you so much. Do you know if there is a way to label each axis?
- Mark as New
- Bookmark
- Subscribe
- Mute
- Subscribe to RSS Feed
- Permalink
- Report Inappropriate Content
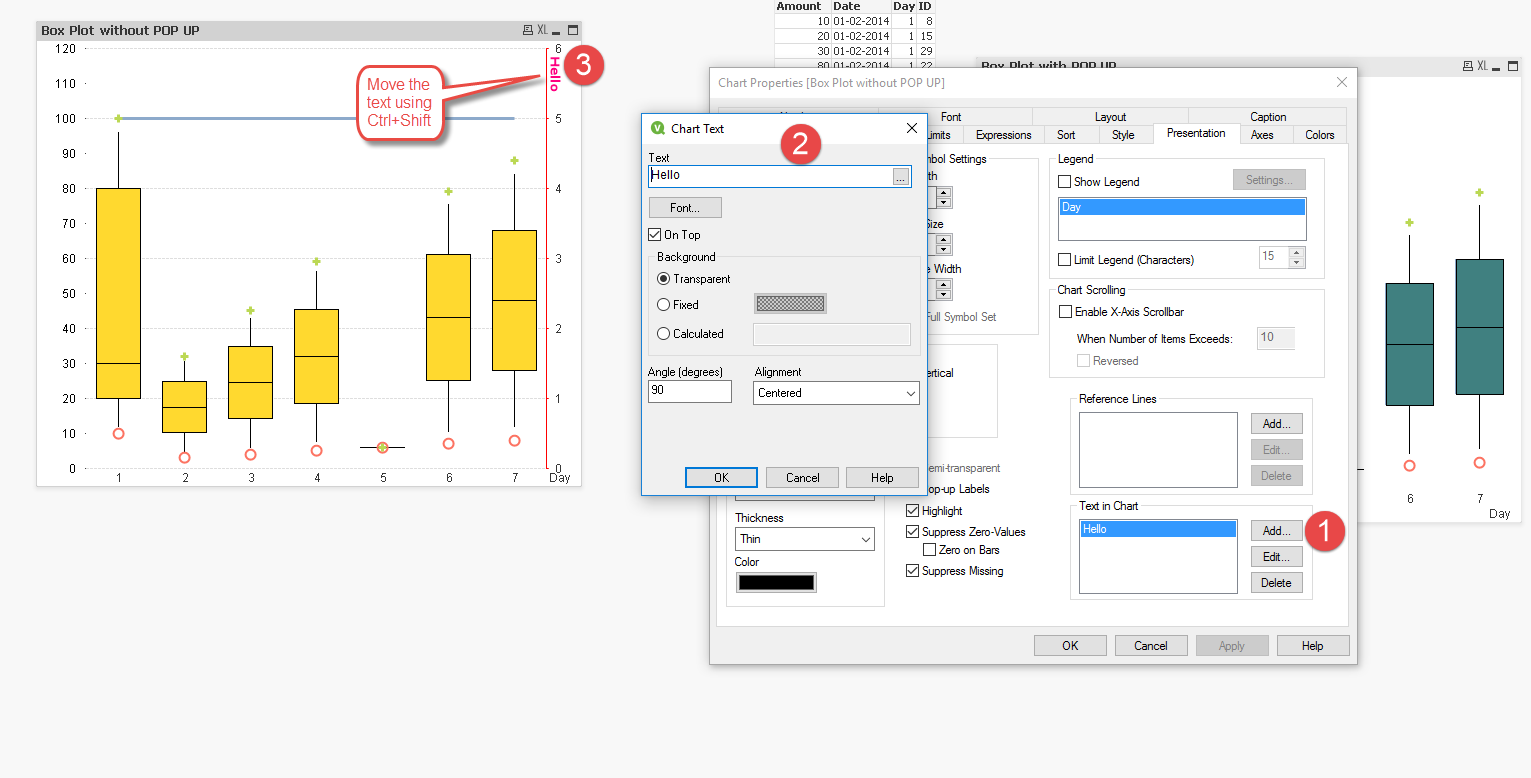
Hmm . I found this workaround ... but attention if you resize o increse the Graph you loose the initial position. Let me know
- Mark as New
- Bookmark
- Subscribe
- Mute
- Subscribe to RSS Feed
- Permalink
- Report Inappropriate Content
Steeven
Thank you for this suggestion and you help with this combo chart; very helpful!
Best
Rick