Unlock a world of possibilities! Login now and discover the exclusive benefits awaiting you.
- Qlik Community
- :
- Forums
- :
- Groups
- :
- Industry and Topics
- :
- Healthcare
- :
- Re: Visualizing Lab Results
- Subscribe to RSS Feed
- Mark Topic as New
- Mark Topic as Read
- Float this Topic for Current User
- Bookmark
- Subscribe
- Mute
- Printer Friendly Page
- Feature this Topic
- Mark as New
- Bookmark
- Subscribe
- Mute
- Subscribe to RSS Feed
- Permalink
- Report Inappropriate Content
Visualizing Lab Results
Have you heard the joke about the lab technician that walks into the room to stick you with a 15” needle and draw your blood? Of course you haven’t that’s just not very funny stuff.
More than likely you are not as afraid of needles as I am, but I doubt anyone likes being told “I need you to roll up your sleeve.” Seriously do they really have to say out load “This is going to sting a little.” I pretty much guessed ahead of time that a long sharp object inserted into my arm would sting a little.
On a serious note though despite the anxiety I feel I am 100% aware of the very valuable insight that lab results provide physicians about my health so I reluctantly tolerate the “sting” and try not to cry until I’ve left. I tell myself I’m brave because I know that there are scaredy cats out there that don’t even see a physician due to their fear. When you are in the hospital it’s not as easy to hide from them though. The lab techs are generally at your bedside very early in the morning, more than likely waking you up, in order to remove a gallon of your blood, or however much those vials hold.
Your blood is then rushed to the lab where a technician runs the myriad of tests that the physician(s) have requested and then the results are generated. Until someone does something with the results of the lab tests the values are simply like all of the 0’s and 1’s that reside on our disks … useless.
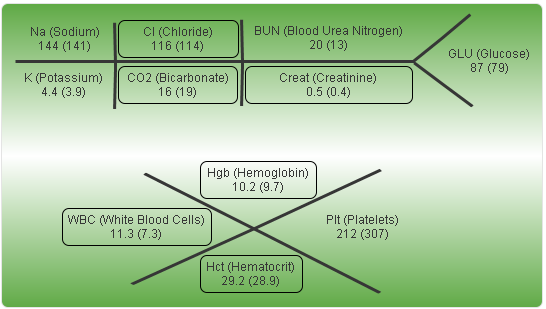
In this post I’m going to discuss how I handled visualizing those lab results for the physicians rounding report I’ve been working on. I began my work on lab results the same way I would anything … “let me see what kind of data and what volume of data I’m dealing with.” LOTS and LOTS. I’m not kidding. It’s almost like every single drop of blood holds 1 MB of data or something. The following is for just the last 3 days of lab results for 1 patient.
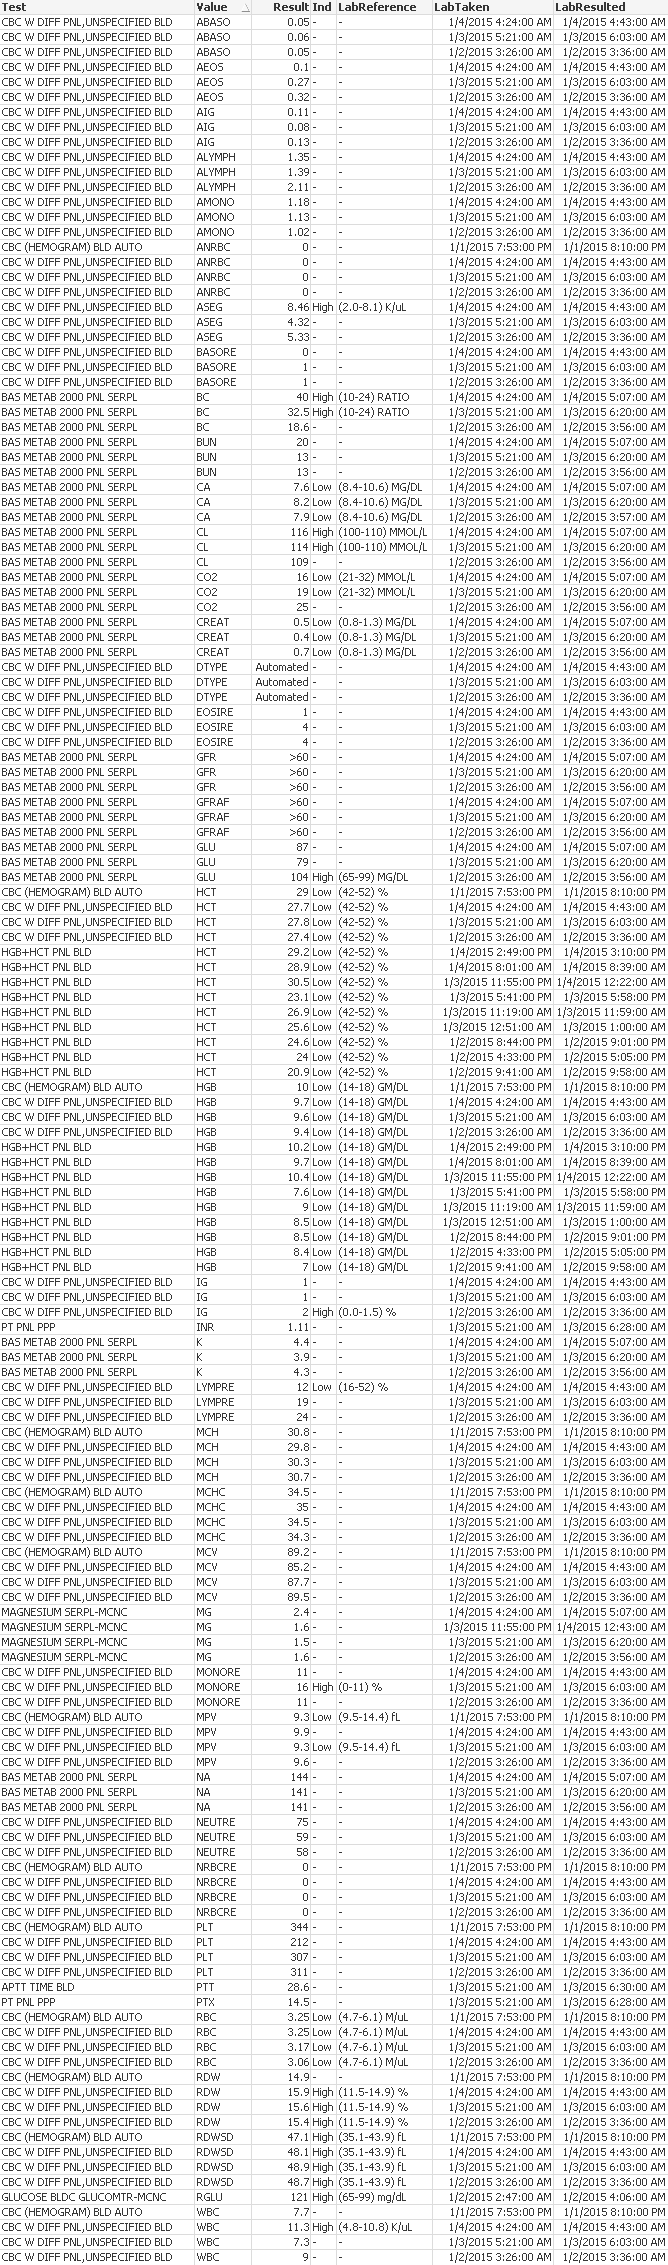
You didn’t like having to scroll all the way down here to finish reading did you? It gets worse … I want you to scroll back up and figure out what the most recent lab result value is for HCT. Painful isn’t it. Certainly we are not going to deliver that as our lab results visualization.
Click here to view the rest of my Visualizing Lab Results at QlikDork.com
I've attached a sample QVW that you can tweak what I've done and come up with your own approach.
- Mark as New
- Bookmark
- Subscribe
- Mute
- Subscribe to RSS Feed
- Permalink
- Report Inappropriate Content
I would argue against the gradient effect in your Fishbone diagram, but other than that, I like it a lot.
- Mark as New
- Bookmark
- Subscribe
- Mute
- Subscribe to RSS Feed
- Permalink
- Report Inappropriate Content
Thanks James.
I'm laughing out loud because for my real report I didn't use the background. But I've been reading so much about infographics I tried to make my image file look prettier than a bunch of black lines on a white background so that others might reuse my image instead of other fishbone diagrams on the web. Thanks for your honesty in calling me out on it. Looking forward to more honest feedback as I continue to try and grow in my ability to visualize the data instead of just slapping the data on the screen.