Unlock a world of possibilities! Login now and discover the exclusive benefits awaiting you.
- Qlik Community
- :
- Forums
- :
- Analytics & AI
- :
- Products & Topics
- :
- Integration, Extension & APIs
- :
- D3 and Qlik Component
- Subscribe to RSS Feed
- Mark Topic as New
- Mark Topic as Read
- Float this Topic for Current User
- Bookmark
- Subscribe
- Mute
- Printer Friendly Page
- Mark as New
- Bookmark
- Subscribe
- Mute
- Subscribe to RSS Feed
- Permalink
- Report Inappropriate Content
D3 and Qlik Component
I have a custom component that takes in 3 measure and a dimension 1. line chart 2. bar chart 3. area chart I am using D3's v4 minified js file. I am still learning and understanding d3 and have a simple grasp of it. But I am stuck on if this is possible or not:
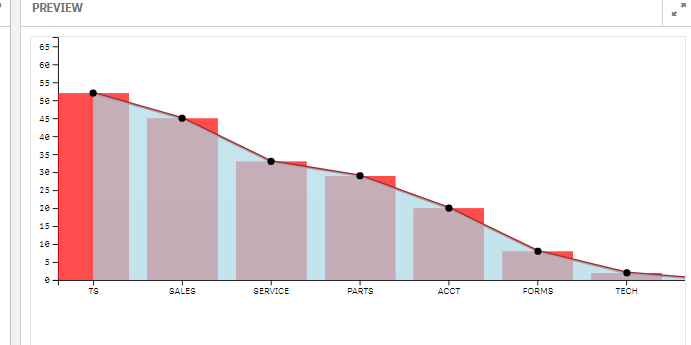
The above chart uses the scaleBand for the barchart/ x - axis.
Which lines up perfectly.
The issue I am having is the above, I have to change the scale to scalePoint, add a padding to line up the point to match the bar-chart.
Is there a way to color or extend the are chart's color so that it starts 0,52 (x,y) - basically where the padding is before the first point, as if it was never padded?
Thanks