Unlock a world of possibilities! Login now and discover the exclusive benefits awaiting you.
- Qlik Community
- :
- Forums
- :
- Analytics & AI
- :
- Products & Topics
- :
- Integration, Extension & APIs
- :
- Grouping Periods of time into ranges
- Subscribe to RSS Feed
- Mark Topic as New
- Mark Topic as Read
- Float this Topic for Current User
- Bookmark
- Subscribe
- Mute
- Printer Friendly Page
- Mark as New
- Bookmark
- Subscribe
- Mute
- Subscribe to RSS Feed
- Permalink
- Report Inappropriate Content
Grouping Periods of time into ranges
Hello everyone,
I have this business scenario that I am working on.
To produce a product X, there is a process that this product follows.
It starts from Stage1, then Stage 2, moving to Stage 3, ending up to Stage4.
First the Client asks for a product, that date/time is the time of creation ; the client has to Confirm that demand for the product to be considered active and start the process of production.
So Starting from Date/Time of Creation --> Stage4 is the period elapsed to deliver the product to the client.
What I need to do is to display that period grouped into ranges. To do that I referred to this post.
That was helpful but I didn't get the result I need.
- The first problem is that the period can be Days and hours.
- The client wants to see the period in chunks of 2 hours.
- When I calculate the difference between (Stage4 - Stage1) I get the period but I can't project that into specific date.
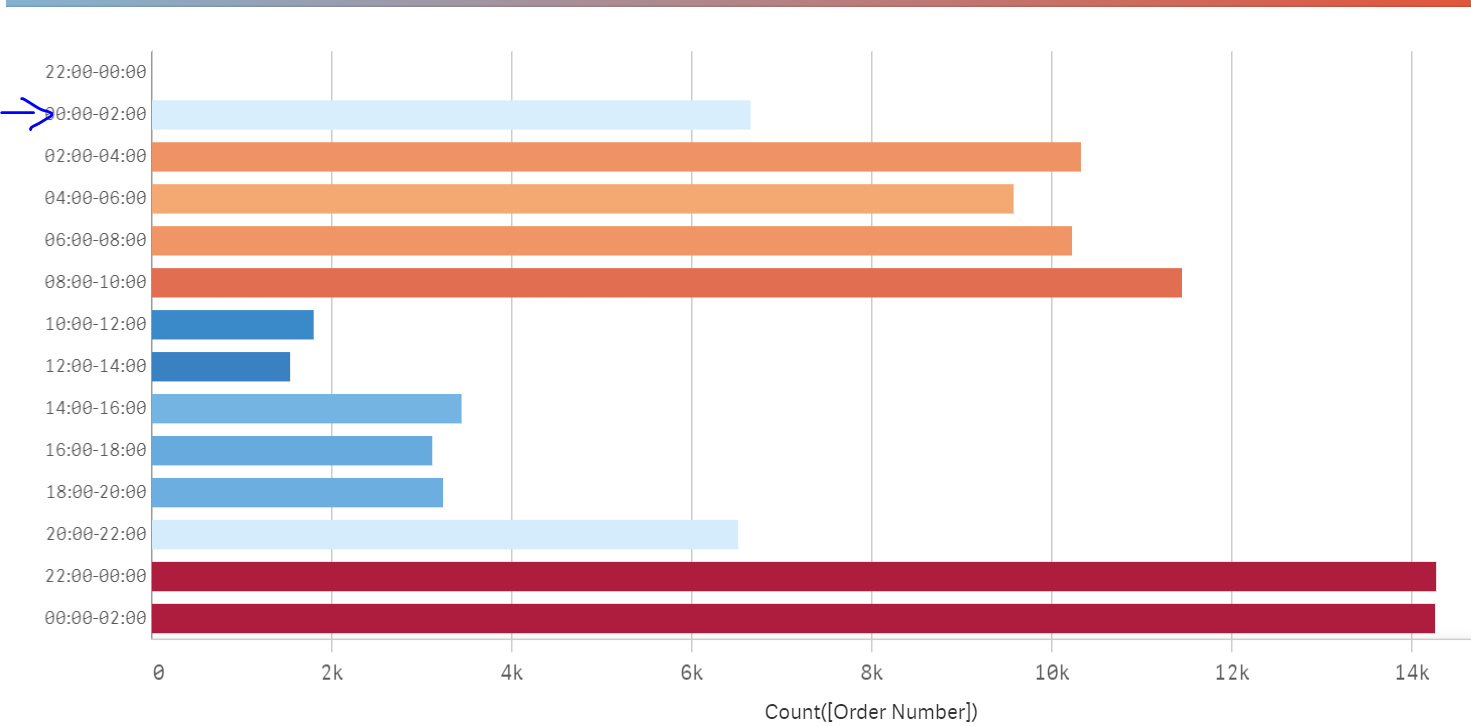
As you see in the graph that chunks of times are well segmented into two hours, but the problem is that it's not real that those orders were processed that time! Because the in the timestamp all orders starts from 8:00 AM ending to 18:00.
This is the code that I have used when loading the data :
Dual( Time(Floor(("To Deliver Date" - "To Print Date"),'02:00:00'),'hh:mm')&'-'&Time(Floor(("To Deliver Date" - "To Print Date")+'02:00:00','02:00:00'),'hh:mm'), Floor(("To Deliver Date" - "To Print Date"),'02:00:00')) as TimeOrderBucket
("To Deliver Date" - "To Print Date") : Gives me the period, the rest is inspired from the discussion I mentioned.
"To Print Date" and "To Print Date" : contains date and time.
My question, how to represent the period that could be days and hours into 2 hours chunks ?
I used the function =Class(Delai, 0.085) ; where 0.085 is serial number of 2 hours. My intention though, is to have a two different hierarchies of time one Bar chart for period in days and next to it another bar chart of periods in hours. When the user clicks on the period that is equal to one day, will reflect the bar chart of orders produced in one day in chunks of two hours.
For Example:
1 Select One day period of production
=> Then I see From 8:00 -> 10:00 (55 Orders produced and delivered)
=> 10:00 -> 12:00 (23 orders) and so on.
Excuse me if the elaboration is quite long, but I think I have to put these details and my intention to help out.
Thanks, and looking forward your replies.