Unlock a world of possibilities! Login now and discover the exclusive benefits awaiting you.
- Qlik Community
- :
- All Forums
- :
- Integration, Extension & APIs
- :
- Re: Scatter Heatmap Extension for Qlik Sense 1.1
- Subscribe to RSS Feed
- Mark Topic as New
- Mark Topic as Read
- Float this Topic for Current User
- Bookmark
- Subscribe
- Mute
- Printer Friendly Page
- Mark as New
- Bookmark
- Subscribe
- Mute
- Subscribe to RSS Feed
- Permalink
- Report Inappropriate Content
Scatter Heatmap Extension for Qlik Sense 1.1
Hi all,
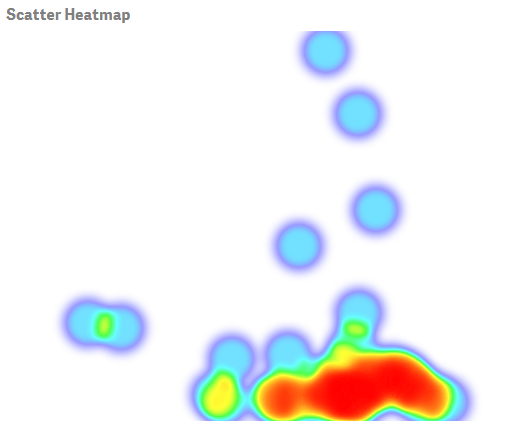
I just made my first Qlik Sense Extension and uploaded it on qlik branch and github. You can use it to create heat maps as in the picture below. Please feel free to comment or suggest improvements.
Mark

- Mark as New
- Bookmark
- Subscribe
- Mute
- Subscribe to RSS Feed
- Permalink
- Report Inappropriate Content
Hi Mark,
Am looking for exactly the same kind of distribution of heat maps in world maps that am using. Could you please share me the exact steps on how to implement this scatter heat plots on my world maps? I'm using Qliksense 2.0.1 version .
Any help on this is much appreciated.
Thanks,
Kavitha
- Mark as New
- Bookmark
- Subscribe
- Mute
- Subscribe to RSS Feed
- Permalink
- Report Inappropriate Content
Hi Kavitha,
This was just a home project testing the use of an existing javascript library for heatmaps (simpleheat.js) in a D3.js graph in a standard sense template.
All code is included in links to github.
I recently saw some code for heatmaps on world maps, just using the google API and the included HeatMap layer. I'm sure you could make this work with sense, but my 'technical knowledge' on this is rather limited.
I am even not sure this works in version 2 of Sense.
Good luck,
Mark