Unlock a world of possibilities! Login now and discover the exclusive benefits awaiting you.
- Qlik Community
- :
- Support
- :
- Support
- :
- Knowledge
- :
- Member Articles
- :
- QlikView App: Accumulate values in the Data Model
- Move Document
- Delete Document
- Subscribe to RSS Feed
- Mark as New
- Mark as Read
- Bookmark
- Subscribe
- Printer Friendly Page
- Report Inappropriate Content
QlikView App: Accumulate values in the Data Model
- Move Document
- Delete Document and Replies
- Mark as New
- Bookmark
- Subscribe
- Mute
- Subscribe to RSS Feed
- Permalink
- Report Inappropriate Content
QlikView App: Accumulate values in the Data Model
This example QlikView app shows a number of different ways that values can be accumulated by loading associated tables based on the existing data.
Three scenarios are looked at:
A straight accumulation of values that accumulate to match a total over a number of days.
A moving annual total where for each period 12 months of values are rolled up.
Creating an Average bar appearing as an extra bar within a bar chart
In all cases a new dimension is created to allow for the total to be created.
This document was produced to support the Quick Intelligence Blog posting Accumulate Values In The QlikView Data Model. This blog discusses the techniques used so that you can use them in your own documents.
Please see my other documents uploaded to Qlik Community for further tutorials and examples.
Many thanks,
Steve Dark
- Move Comment
- Delete Comment
- Mark as Read
- Mark as New
- Bookmark
- Permalink
- Report Inappropriate Content
Really a good work Steve and very helpful.
Thanks for such concepts.
- Move Comment
- Delete Comment
- Mark as Read
- Mark as New
- Bookmark
- Permalink
- Report Inappropriate Content
Hi Steve, thanks for your post... waht happend if I need to calculate for example in the same Line Graphic a line of Growth and Delta, how can I do that..? because there, I need to compare MAT on March-13 vs MAT on March-14. Thanks for your help!
Best Regards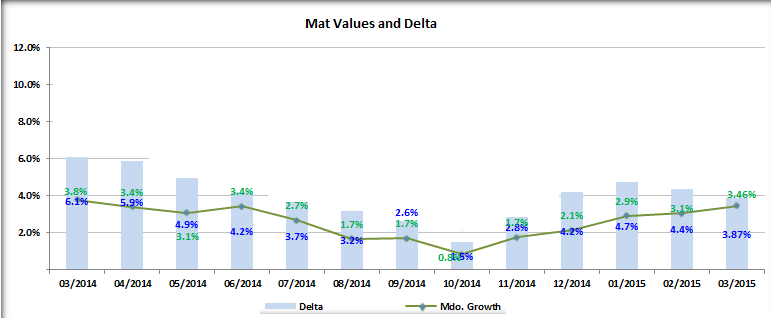
- Move Comment
- Delete Comment
- Mark as Read
- Mark as New
- Bookmark
- Permalink
- Report Inappropriate Content
Hi Carlos,
To do this you will need to combine techniques from a couple of the points in the associated post. You will be accumulating twelve months against a single dimension value to give a MAT. At the same time as this you will need to associate the previous twelve months with the same dimension. As well as the association to the twenty four months, you will need another field with two different descriptions, e.g. 'TY MAT' and 'PY MAT'. You can then plot the two lines and calculate the deltas as well.
Hope that points you in the right direction.
Cheers,
Steve