Unlock a world of possibilities! Login now and discover the exclusive benefits awaiting you.
- Qlik Community
- :
- Forums
- :
- Analytics
- :
- New to Qlik Analytics
- :
- Re: 100% stacked bar chart - one bar for one field
- Subscribe to RSS Feed
- Mark Topic as New
- Mark Topic as Read
- Float this Topic for Current User
- Bookmark
- Subscribe
- Mute
- Printer Friendly Page
- Mark as New
- Bookmark
- Subscribe
- Mute
- Subscribe to RSS Feed
- Permalink
- Report Inappropriate Content
100% stacked bar chart - one bar for one field
As far as I can understand, I can create stacked bar charts, where bars are formed based on distinct values found in a referenced field.
But how can I create a 100% stacked bar chart, where each bar would correspond to one field?
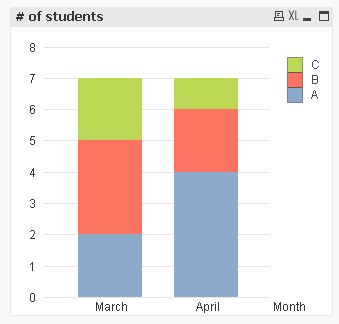
E. g., I'd like this data

to be represented something like this:

What expressions should I write in dimension and measure fields?
- Mark as New
- Bookmark
- Subscribe
- Mute
- Subscribe to RSS Feed
- Permalink
- Report Inappropriate Content
First you should transform your data using The Crosstable Load and then you can do like this
Dimension
Month
Value
Expression
Count(DISTINCT Student)/Count(TOTAL <Month> Student)
- Mark as New
- Bookmark
- Subscribe
- Mute
- Subscribe to RSS Feed
- Permalink
- Report Inappropriate Content
Thank you for the idea. I had a similar one, but...
What I can see, the crosstable load reallocates everything what was put nicely into columns, into many rows. In my original data, I have 100k rows (students, who have responded to a survey). And in columns I have different questions (it's not months in the original data, but questions; and the answers can only take a form of integer from 0 to 5). There are 65 questions. Putting all the different questions into 1 column just for the sake of 1 problematic chart doesn't make much sense. Also, this way I would end up with 6.5m rows, which doesn't seem nice either.
There must be a better way, without distorting the order in the table.
- Mark as New
- Bookmark
- Subscribe
- Mute
- Subscribe to RSS Feed
- Permalink
- Report Inappropriate Content
So, no simple way? Do I really need to create additional tables? Is it really more efficient to have fewer columns, but way more rows?
- Mark as New
- Bookmark
- Subscribe
- Mute
- Subscribe to RSS Feed
- Permalink
- Report Inappropriate Content
I am not sure I understand your concerns with CrossTable load? It is rather more efficient to transform your data using CrossTable as it's management becomes so much easier. 6.5 millions sound a lot, but vs having multiple columns? I don't see any performance decrease as the number of cells should remain more or less the same... in fact the nulls can be removed and you should have lesses number of rows.
- Mark as New
- Bookmark
- Subscribe
- Mute
- Subscribe to RSS Feed
- Permalink
- Report Inappropriate Content
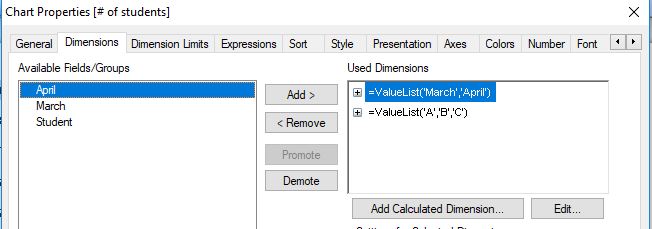
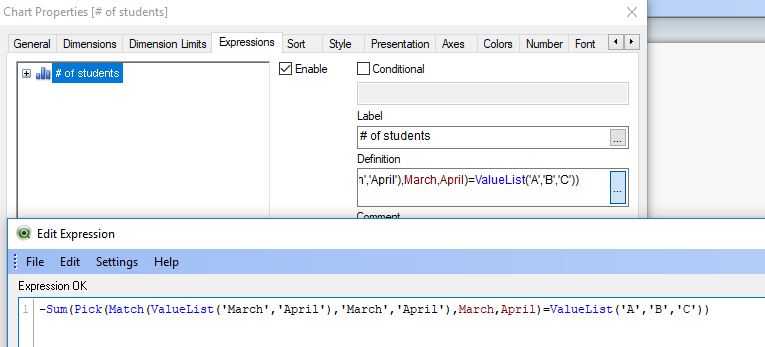
Although I don't recommend this... but if you really wish to make it difficult... you can try this

- Mark as New
- Bookmark
- Subscribe
- Mute
- Subscribe to RSS Feed
- Permalink
- Report Inappropriate Content
Hi,
another method of making things complicated that would be so much easier given the proper data model:
hope this helps
regards
Marco
- Mark as New
- Bookmark
- Subscribe
- Mute
- Subscribe to RSS Feed
- Permalink
- Report Inappropriate Content
... and for comparison a crosstable solution like Sunny already suggested:
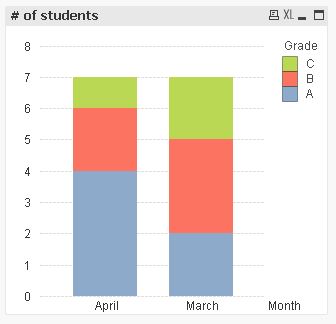
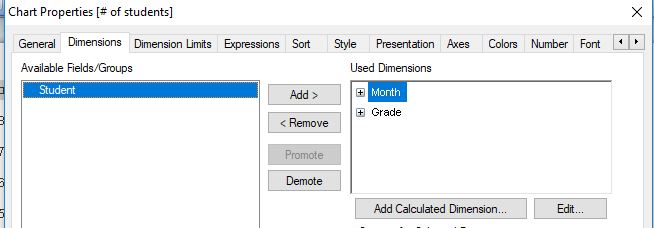
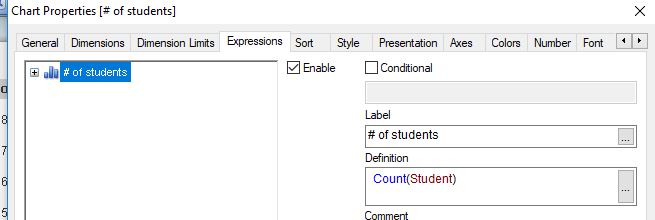
table1:
CrossTable (Month, Grade)
LOAD * INLINE [
    Student, March, April
    student1, A, A
    student2, A, A
    student3, C, B
    student4, B, A
    student5, C, A
    student6, B, C
    student7, B, B
];
hope this helps
regards
Marco