Unlock a world of possibilities! Login now and discover the exclusive benefits awaiting you.
- Qlik Community
- :
- Forums
- :
- Analytics
- :
- New to Qlik Analytics
- :
- Re: Adding manual rows in a P&L table in Qlik Sens...
- Subscribe to RSS Feed
- Mark Topic as New
- Mark Topic as Read
- Float this Topic for Current User
- Bookmark
- Subscribe
- Mute
- Printer Friendly Page
- Mark as New
- Bookmark
- Subscribe
- Mute
- Subscribe to RSS Feed
- Permalink
- Report Inappropriate Content
Adding manual rows in a P&L table in Qlik Sense
Hi everyone,
This is my first post in the community and I am sure it won't be last. I was wondering if any of you knew how to add rows within a dimension in order to create a P&L. So far I can pull the data in the following format:
| Categorised (CTD) |
| Revenue |
| CoS - Circuits |
| CoS - Other |
| CoS - Resources |
| Direct Opex |
| Opex Resources |
| Overheads |
| LRAIC Opex |
| Depreciation |
| Capex |
| LRAIC Capex |
| Net Working Capital |
Cost excl OH |
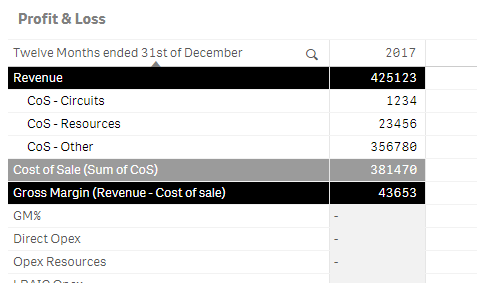
However, I need it to end up looking like this?
| Revenue |
| CoS - Circuits |
| CoS - Resources |
| CoS - Other |
| Cost of Sale (Sum of CoS) |
| Gross Margin (Revenue - Cost of sale) |
| GM% |
| Direct Opex |
| Opex Resources |
| LRAIC Opex |
| Total Opex |
| Overheads |
| EBITDA (Gross Margin + Total Opex + Overheads) |
| EBITDA % |
| Depreciation |
| LRAIC Capex |
| EBIT (EBITDA + Depreciation + LRAIC Capex) |
| EBIT % |
Is there any way I can manually code that in the backend/front end to make sure the dimension contains the right information.
Thank you very much.
Accepted Solutions
- Mark as New
- Bookmark
- Subscribe
- Mute
- Subscribe to RSS Feed
- Permalink
- Report Inappropriate Content
Sure - here is a sample load script with an inline load of data that can of course be read from an Excel file or other database sources instead:
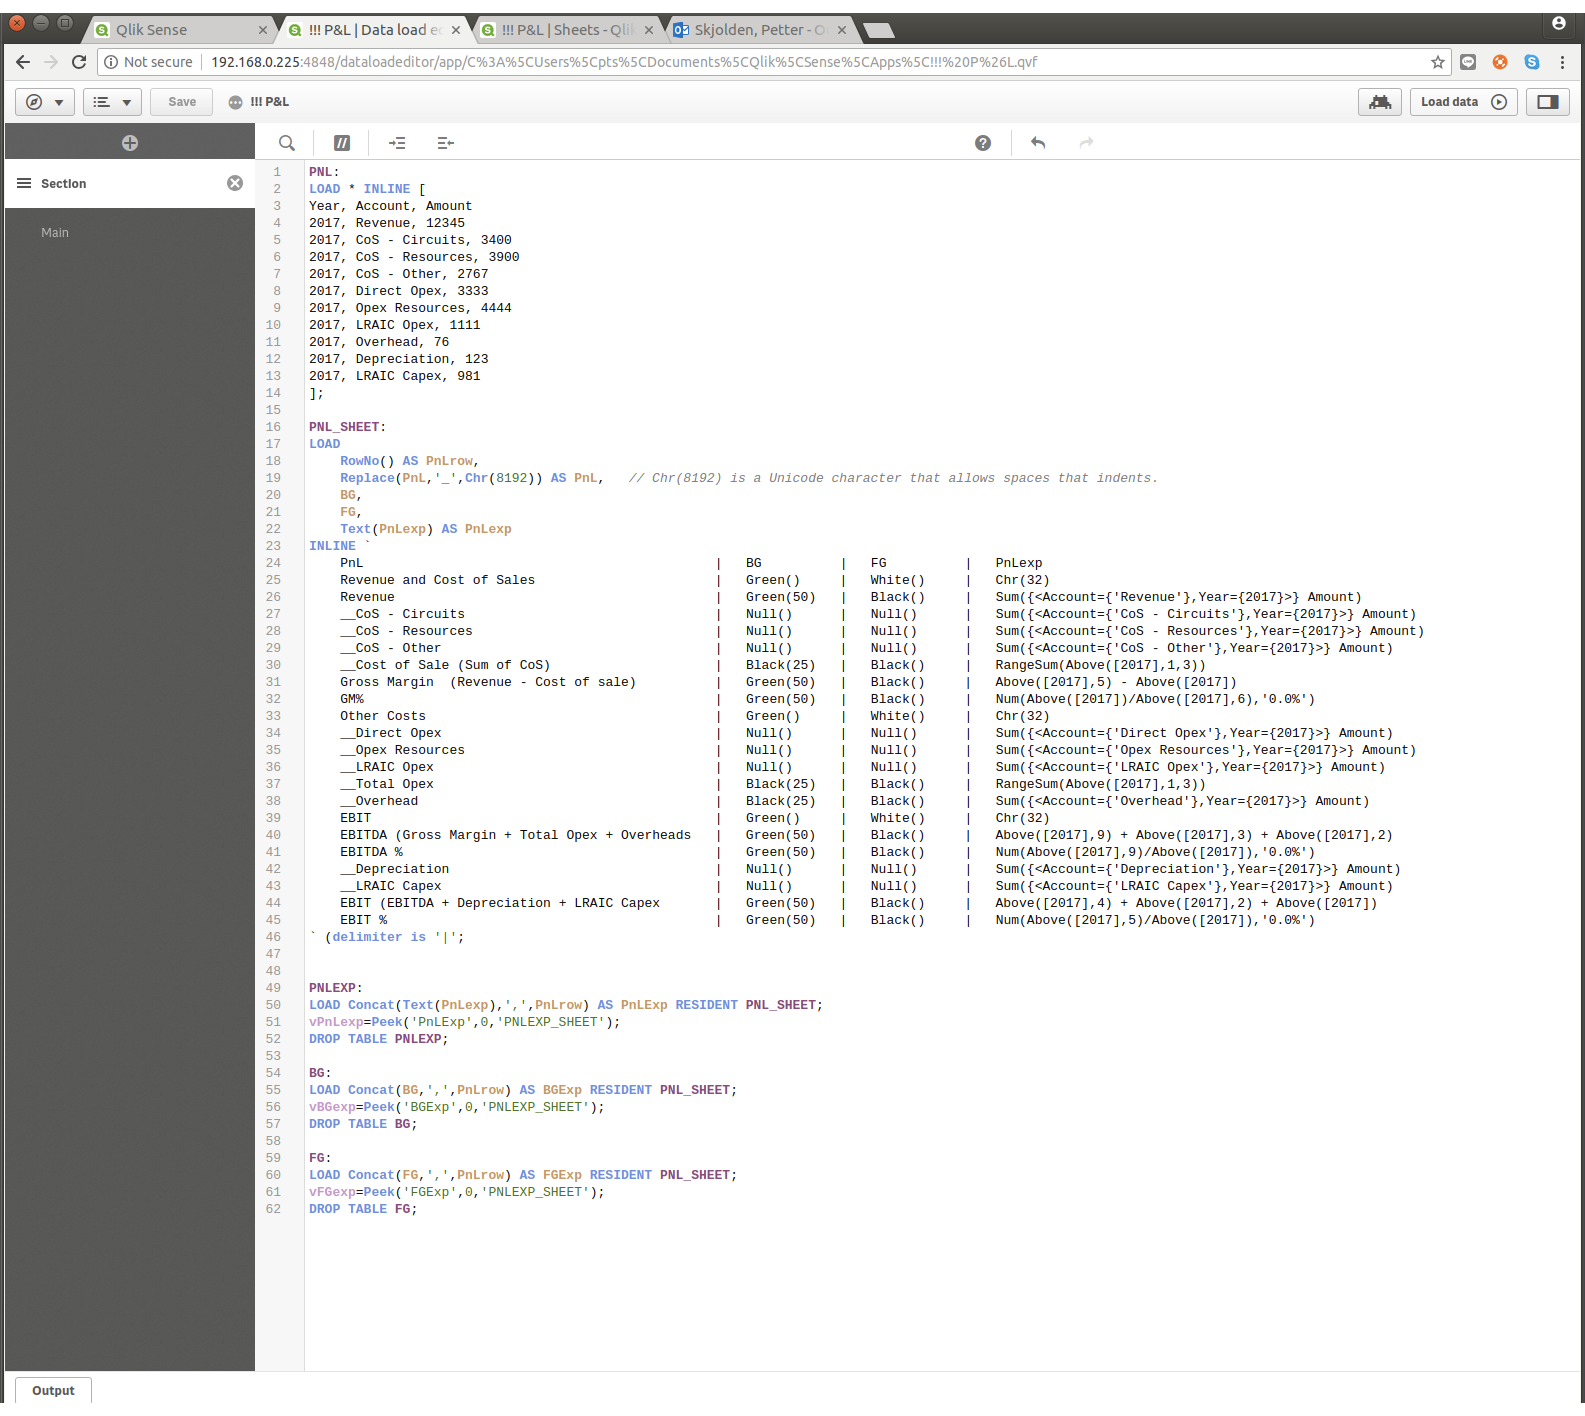

I have attached the Qlik Sense Application too.
- Mark as New
- Bookmark
- Subscribe
- Mute
- Subscribe to RSS Feed
- Permalink
- Report Inappropriate Content
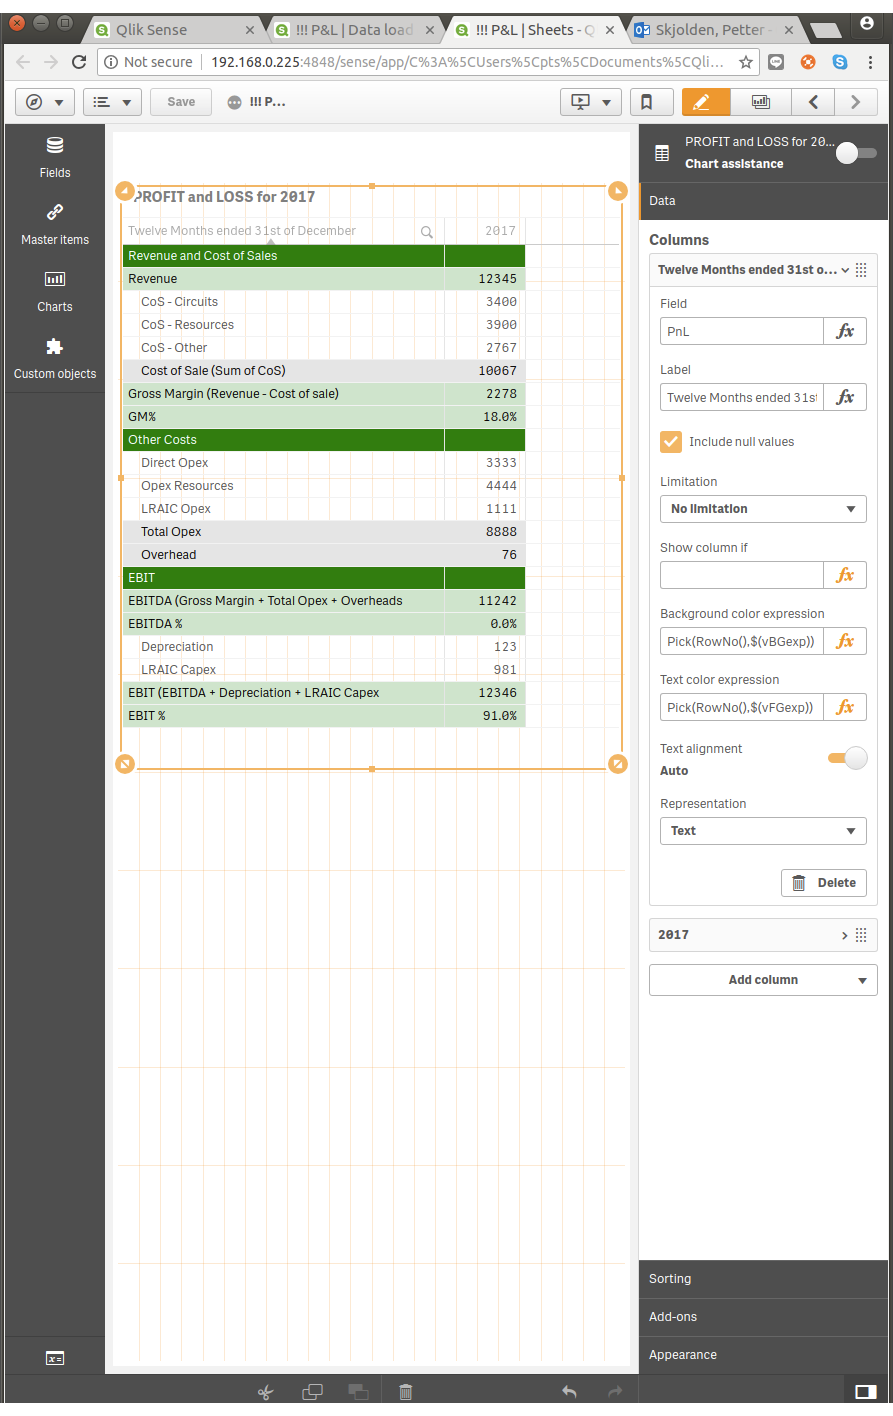
It is possible to get a P&L that looks like this:
But you can't get bolded text - so you will have to use the background color as a way of highligthing different levels instead. Does this satisfy your requirements?
With this you can also specify simple calculations like Cost of Sale should be sum of the above three rows:
RangeSum(Above([2017],1,3))
And the Gross Margin (Revenue - Cost of sale):
Above([2017],5)-Above([2017],1)
Each individual row can have it's own specific expression independent of the others.
- Mark as New
- Bookmark
- Subscribe
- Mute
- Subscribe to RSS Feed
- Permalink
- Report Inappropriate Content
Yes it does! Thank you so much Petter. Would you mind sharing what is the most efficient way to code that please?
Thank you!
- Mark as New
- Bookmark
- Subscribe
- Mute
- Subscribe to RSS Feed
- Permalink
- Report Inappropriate Content
Sure - here is a sample load script with an inline load of data that can of course be read from an Excel file or other database sources instead:
I have attached the Qlik Sense Application too.
- Mark as New
- Bookmark
- Subscribe
- Mute
- Subscribe to RSS Feed
- Permalink
- Report Inappropriate Content
If you want the bold text and more layout options you can take a look at our Finance Report extension for Qlik Sense. It will cost you a small monthly fee but it's a completely different experience compared to native Qlik Sense or the free extensions out there. More features, better performance and it also comes with a very competent template to get you started quickly and save many hours of development. The Climber Finance Report 2.0 for Qlik Sense | Michael Nordström - YouTube
- Mark as New
- Bookmark
- Subscribe
- Mute
- Subscribe to RSS Feed
- Permalink
- Report Inappropriate Content
Really appreciate your example! How would I go about to add additional years in the P&L?
- Mark as New
- Bookmark
- Subscribe
- Mute
- Subscribe to RSS Feed
- Permalink
- Report Inappropriate Content
HI Petter,
I really like the solution you've written here
Due to system issues I can't open your QVF above. I don't suppose you've got a text/word version of the code I can play with and alter please.
Many thanks