Unlock a world of possibilities! Login now and discover the exclusive benefits awaiting you.
- Qlik Community
- :
- Forums
- :
- Analytics
- :
- New to Qlik Analytics
- :
- Dimensions with same values
- Subscribe to RSS Feed
- Mark Topic as New
- Mark Topic as Read
- Float this Topic for Current User
- Bookmark
- Subscribe
- Mute
- Printer Friendly Page
- Mark as New
- Bookmark
- Subscribe
- Mute
- Subscribe to RSS Feed
- Permalink
- Report Inappropriate Content
Dimensions with same values
Hello Qlik Sense community,
i have some trouble with this file:
| Project | Support (Sources) | ||||||||
| SCM | IT | Eng | PMO | Lean | Security | OPS/SD | Other | ||
| Project A | H | L | M | ||||||
| Project B | H | M | M | ||||||
| Project C | M | H | H | H | |||||
| Project D | L | L | M | ||||||
| Project E | H | L | L | ||||||
There are more dimensions (SCM, IT, ENG, PMO, LEAN, SECURITY,...) with same values (H,M,L).
I would like to get something like this (column project not important for this chart):
Information about priority H, L, M for single departmants.
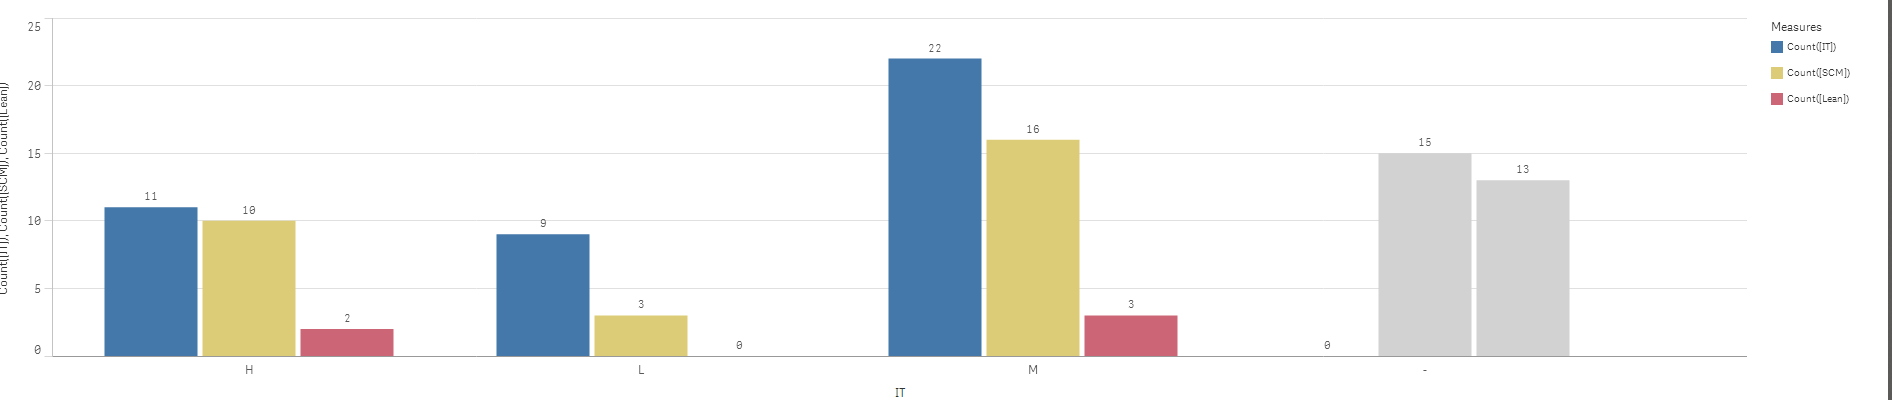
There is problem with dimension... In this example i picked up dimension IT and measures:
Count (IT)
Count(SCM)
Count(Lean)
There are correct results only for Count (IT).
Do you have any idea? I dont know,how i get correct results.
Thanks, for reply.
Accepted Solutions
- Mark as New
- Bookmark
- Subscribe
- Mute
- Subscribe to RSS Feed
- Permalink
- Report Inappropriate Content
My problem was solved by command CROSSTABLE in script. 
- Mark as New
- Bookmark
- Subscribe
- Mute
- Subscribe to RSS Feed
- Permalink
- Report Inappropriate Content
Could you supply us with a data model and some example data?
Count() will sometimes give the wrong result if you are not using "distinct" in there.
- Mark as New
- Bookmark
- Subscribe
- Mute
- Subscribe to RSS Feed
- Permalink
- Report Inappropriate Content
Thanks for reaction.
It's only 1 xlsx file, so data model isnt important.
For example file contains this data:
| Project | Support (Sources) | ||||||||
| SCM | IT | Eng | PMO | Lean | Security | OPS/SD | Other | ||
| Project A | H | L | M | ||||||
| Project B | H | M | M | ||||||
| Project C | M | H | H | H | |||||
| Project D | L | L | M | ||||||
| Project E | H | L | L | ||||||
- Mark as New
- Bookmark
- Subscribe
- Mute
- Subscribe to RSS Feed
- Permalink
- Report Inappropriate Content
My problem was solved by command CROSSTABLE in script.