Unlock a world of possibilities! Login now and discover the exclusive benefits awaiting you.
- Qlik Community
- :
- Forums
- :
- Analytics
- :
- New to Qlik Analytics
- :
- Display error table chart in Mashup
- Subscribe to RSS Feed
- Mark Topic as New
- Mark Topic as Read
- Float this Topic for Current User
- Bookmark
- Subscribe
- Mute
- Printer Friendly Page
- Mark as New
- Bookmark
- Subscribe
- Mute
- Subscribe to RSS Feed
- Permalink
- Report Inappropriate Content
Display error table chart in Mashup
Hi everyone,
I noticed, that a table chart produces some weird text in a mashup.
The occurrence seems to depend on the pages zoom level.
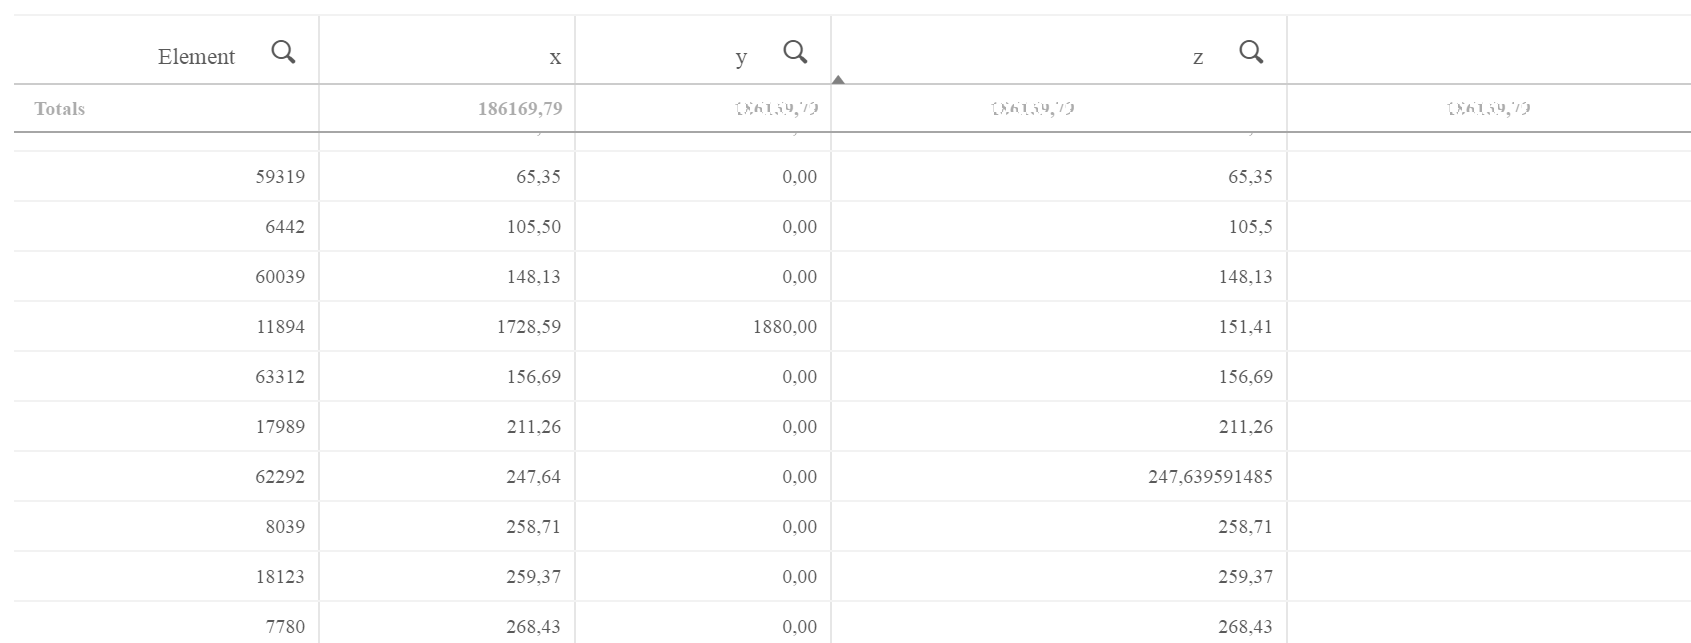
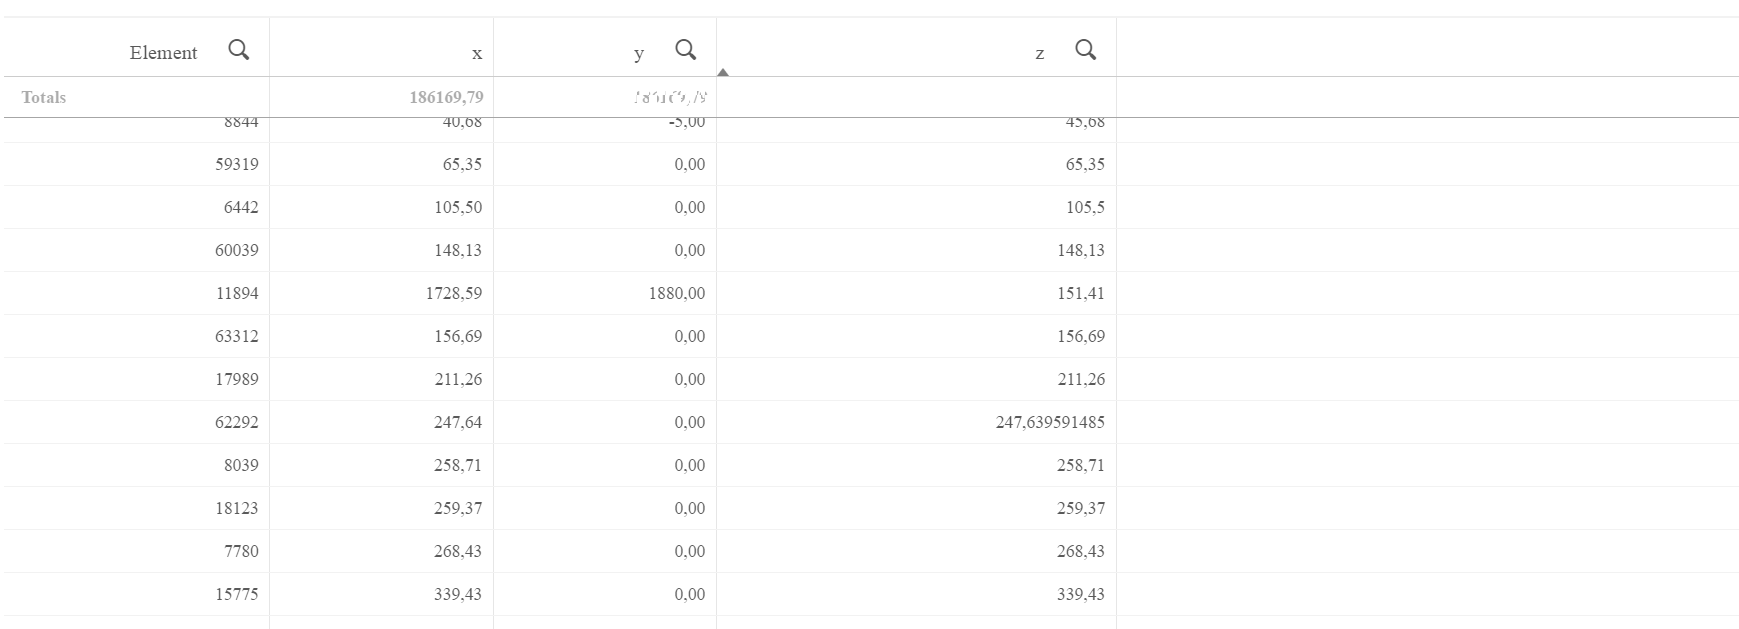 As you can see there are strange entries in the Totals row in columns y and z and also in the empty column on the right. In the qlik app columns y and z are empty. The strange value seems to be a misformatted version of the entry from column x. However if I zoom out a little the entries are gone but the one in column y.
Inspecting the DOM I can only find an entry for the cell Totals:x. The other cells in this row seem empty. Nothing in the html or css points to what this is.
Has anyone encountered such a problem or does anyone know a solution?
Glad for any input.
Thanks,
Marco
- Mark as New
- Bookmark
- Subscribe
- Mute
- Subscribe to RSS Feed
- Permalink
- Report Inappropriate Content
[Update]
The issue seems to come from a nbsp in the auto-generated html.
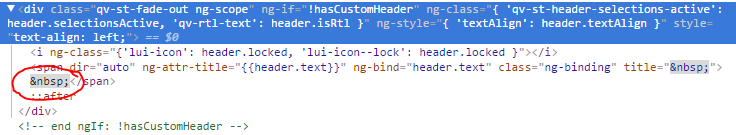
Is there a way to get rid of it via Qlik?
- Mark as New
- Bookmark
- Subscribe
- Mute
- Subscribe to RSS Feed
- Permalink
- Report Inappropriate Content
You are tagging by using Angular JS. Remove that and let us know how this works and meantime, Please produce some text if the text displays then it's work
- Mark as New
- Bookmark
- Subscribe
- Mute
- Subscribe to RSS Feed
- Permalink
- Report Inappropriate Content
afaik there is no way to avoid using angular, as this code is produced by the qlik engine. If not please let me know how.
If I delete the nbsp or use some text everything is displayed right.