Unlock a world of possibilities! Login now and discover the exclusive benefits awaiting you.
- Qlik Community
- :
- Forums
- :
- Analytics
- :
- New to Qlik Analytics
- :
- Doubt in Qlik Sense interval Match
- Subscribe to RSS Feed
- Mark Topic as New
- Mark Topic as Read
- Float this Topic for Current User
- Bookmark
- Subscribe
- Mute
- Printer Friendly Page
- Mark as New
- Bookmark
- Subscribe
- Mute
- Subscribe to RSS Feed
- Permalink
- Report Inappropriate Content
Doubt in Qlik Sense interval Match
Hi,
I have question regarding employees table :
EmpID,WefDate,Dept
1,15/07/2016,HR
1,01/01/2017,Admin
2,25/09/2016,HR
3,25/09/2016,Analytics Developer
3,01/02/2017,Analytics Sales
4,01/08/2016,Analytics Sales
This is the data of the employees w.r.t their departments except 2 and 4 both have changed their departments with time.
Now we have another of employees details which tells us the DOJ and DOL of an employee :-
EmpID,DOJ,DOL
1,15/07/2016,-
2,25/09/2016,31/12/2016
3,25/09/2016,-
4,01/08/2016,-
The - means they are still in the Company so now the Question is
Show Department Wise Month Wise Head Count Trend Of Employees.......?
Thanks..
- Tags:
- mike ta
- Mark as New
- Bookmark
- Subscribe
- Mute
- Subscribe to RSS Feed
- Permalink
- Report Inappropriate Content
Hi Gulshan,
I did not really understand your question, but for the use of the interval match function, here's how you proceed in your case:
fact:
load * inline [
EmpID,WefDate,Dept
1,15/07/2016,HR
1,01/01/2017,Admin
2,25/09/2016,HR
3,25/09/2016,Analytics Developer
3,01/02/2017,Analytics Sales
4,01/08/2016,Analytics Sales
];
details:
load*,
DATE(DOJ)&' - '&date(DOL) as Period;
load * Inline [
EmpID,DOJ,DOL
1,15/07/2016,
2,25/09/2016,31/12/2016
3,25/09/2016,
4,01/08/2016,
];
Bridge:
inner join IntervalMatch("WefDate",EmpID)
Load distinct
DOJ,
DOL,EmpID Resident details;
Result:
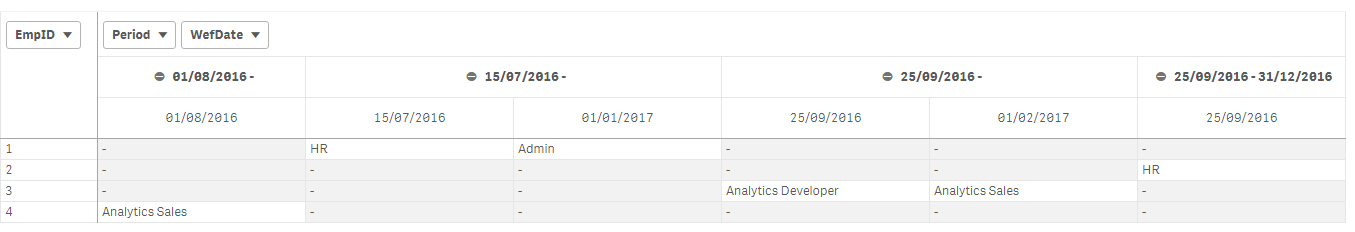
You'll find a test app attached.
Omar,
- Mark as New
- Bookmark
- Subscribe
- Mute
- Subscribe to RSS Feed
- Permalink
- Report Inappropriate Content
Hi Omar,
Thanks for the reply. I think this is not the case of interval match. We just need to show the month wise dept. wise head count. After calculating the employees which left the company.
- Mark as New
- Bookmark
- Subscribe
- Mute
- Subscribe to RSS Feed
- Permalink
- Report Inappropriate Content
What do you mean by :
- month wise dept?
- wise head count?
- Mark as New
- Bookmark
- Subscribe
- Mute
- Subscribe to RSS Feed
- Permalink
- Report Inappropriate Content
I mean how many persons are there in the company in each department month wise. like initially employee 1 was an Admin after that he was an HR. so it shows in the graph that on Sept. there was one HR after that in oct there is no HR like wise i want to plot all the employees on the graph.
- Mark as New
- Bookmark
- Subscribe
- Mute
- Subscribe to RSS Feed
- Permalink
- Report Inappropriate Content
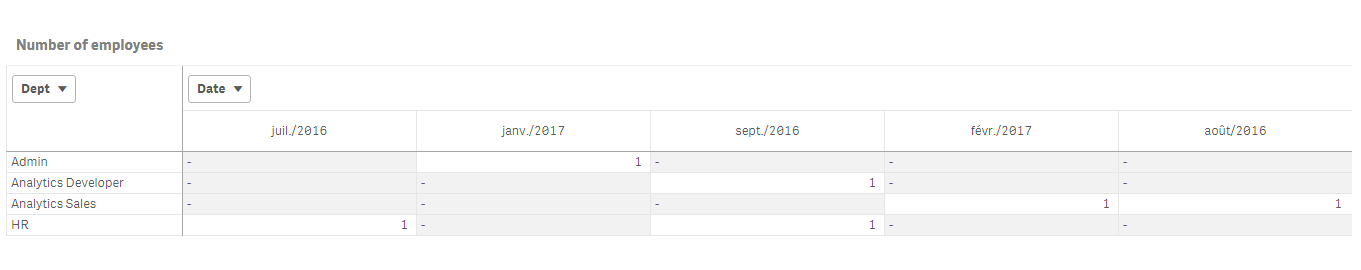
You mean, sthing like this?
- Mark as New
- Bookmark
- Subscribe
- Mute
- Subscribe to RSS Feed
- Permalink
- Report Inappropriate Content
Exactly Omar...!!!
- Mark as New
- Bookmark
- Subscribe
- Mute
- Subscribe to RSS Feed
- Permalink
- Report Inappropriate Content
See the attached app:
- Mark as New
- Bookmark
- Subscribe
- Mute
- Subscribe to RSS Feed
- Permalink
- Report Inappropriate Content
Thanku Omar...!!!
Can you Explain me How you did it...
- Mark as New
- Bookmark
- Subscribe
- Mute
- Subscribe to RSS Feed
- Permalink
- Report Inappropriate Content
Hi again and sorry for the late answer, It's sunday you know 
So , it's really simple, since you already have the information in your source, each Employee in which department by date..
So, no need to alter your source and add an interval match as I did.
You want to see your Department as a dimension in a table to work with:
So put Department in your case a dimension.
Now we wanna track "something" by Month / Year
We don't have a field called Month / Year in your source, but we do have a date field : WefDate.
So, we create our month field by using the Month function that exctract the month of each date;
example: month( '31/02/2016') => February . Year('31/02/2016') => 2016
So to resume : our columns will be : Month(WefDate)&'/'&Year(WefDate) : the & is to concatenate.
Now, we said that we want to track "something"; this something is our measure, which is the number of employees:
Count(EmpID) will then be our measure.
With that, we will see by department the number of Employees and track it by month/year (our column).
Hope this was clear 
And please, don't forget to close the thread by marking an answer as a correct answer.
Have nice days