Unlock a world of possibilities! Login now and discover the exclusive benefits awaiting you.
- Qlik Community
- :
- Forums
- :
- Analytics
- :
- New to Qlik Analytics
- :
- Re: Extra row required - how to add
- Subscribe to RSS Feed
- Mark Topic as New
- Mark Topic as Read
- Float this Topic for Current User
- Bookmark
- Subscribe
- Mute
- Printer Friendly Page
- Mark as New
- Bookmark
- Subscribe
- Mute
- Subscribe to RSS Feed
- Permalink
- Report Inappropriate Content
Extra row required - how to add
Hi,
I've taken a look around the forums and can't find an answer to this.
I have a simple table:
Status Understanding Team Credibility
Won 9 8 9
Lost 5 2 4
I want to add a new calculated row that shows the difference between won/lost values so values would be 4, 6 and 5. Is this possible and how do I do it?
thanks,
Chris
- « Previous Replies
-
- 1
- 2
- Next Replies »
- Mark as New
- Bookmark
- Subscribe
- Mute
- Subscribe to RSS Feed
- Permalink
- Report Inappropriate Content
Hi Sangram,
this would work best for small numbers I presume but when I scale up to 6 categories and 1,000 rows it will be trickier?
Thanks,
Chris
- Mark as New
- Bookmark
- Subscribe
- Mute
- Subscribe to RSS Feed
- Permalink
- Report Inappropriate Content
Very true. I can even simply create this table in Excel and load it which would work but I want Qlik to do the work for me if possible.
- Mark as New
- Bookmark
- Subscribe
- Mute
- Subscribe to RSS Feed
- Permalink
- Report Inappropriate Content
Is the raw data looks like this?
Status Understanding Team Credibility
Won 9 8 9
Lost 5 2 4
or this:
| Status | Type | Value |
|---|---|---|
| Won | Understanding | 9 |
| Won | Team | 8 |
| Won | Credibility | 9 |
| Lost | Understanding | 5 |
| Lost | Team | 2 |
| Lost | Credibility | 4 |
- Mark as New
- Bookmark
- Subscribe
- Mute
- Subscribe to RSS Feed
- Permalink
- Report Inappropriate Content
Hi Chris,
A 1000 rows should be fine, but you should only think when there are more than a million rows. So if you have less than 10000 rows, you can surely go for this.
Thanks,
Sangram.
- Mark as New
- Bookmark
- Subscribe
- Mute
- Subscribe to RSS Feed
- Permalink
- Report Inappropriate Content
First one.
- Mark as New
- Bookmark
- Subscribe
- Mute
- Subscribe to RSS Feed
- Permalink
- Report Inappropriate Content
Check this out:
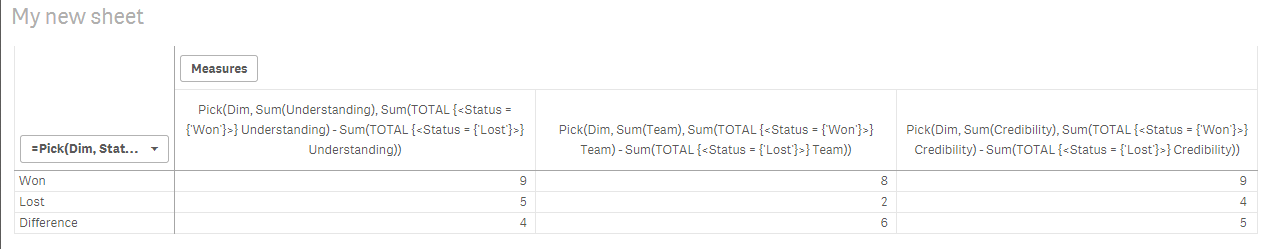
Script:
Table:
LOAD * Inline [
Status, Understanding, Team, Credibility
Won, 9, 8, 9
Lost, 5, 2, 4
];
Dim:
LOAD * Inline [
Dim
1
2
];
Table
Dimension: Pick(Dim, Status, 'Difference')
Expressions:
1) Pick(Dim, Sum(Understanding), Sum(TOTAL {<Status = {'Won'}>} Understanding) - Sum(TOTAL {<Status = {'Lost'}>} Understanding))
2) Pick(Dim, Sum(Team), Sum(TOTAL {<Status = {'Won'}>} Team) - Sum(TOTAL {<Status = {'Lost'}>} Team))
3) Pick(Dim, Sum(Credibility), Sum(TOTAL {<Status = {'Won'}>} Credibility) - Sum(TOTAL {<Status = {'Lost'}>} Credibility))
- Mark as New
- Bookmark
- Subscribe
- Mute
- Subscribe to RSS Feed
- Permalink
- Report Inappropriate Content
Great thanks this works for me as well. Most appreciate the help 
- Mark as New
- Bookmark
- Subscribe
- Mute
- Subscribe to RSS Feed
- Permalink
- Report Inappropriate Content
Awesome
- « Previous Replies
-
- 1
- 2
- Next Replies »