Unlock a world of possibilities! Login now and discover the exclusive benefits awaiting you.
- Qlik Community
- :
- Forums
- :
- Analytics
- :
- New to Qlik Analytics
- :
- Filter Chart using Aggregate function
- Subscribe to RSS Feed
- Mark Topic as New
- Mark Topic as Read
- Float this Topic for Current User
- Bookmark
- Subscribe
- Mute
- Printer Friendly Page
- Mark as New
- Bookmark
- Subscribe
- Mute
- Subscribe to RSS Feed
- Permalink
- Report Inappropriate Content
Filter Chart using Aggregate function
Hello Folks,
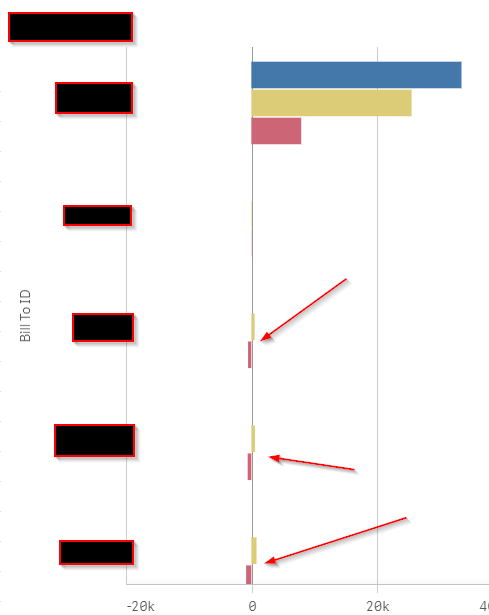
I have a chart where I compute the aggregate sum for a particular field. When the value of this field is Equal To or Less Than 0, I don't want this data point to appear in the bar chart. However, when I put the aggregate function in my Dimension > Field I get "Invalid Dimension"
Below is a picture with arrows pointing to data points that I want hidden.
This the aggregate function I am using to determine if a data point should appear or not.
if(
Sum({<Year = {$(=Max(Year))}>} ChickenWings) - Sum({<Year = {$(=Max(Year-1))}>} ChickenWings) > 0,
[Bill To ID], Null()
)
Any help is greatly appreciated.
Accepted Solutions
- Mark as New
- Bookmark
- Subscribe
- Mute
- Subscribe to RSS Feed
- Permalink
- Report Inappropriate Content
This way?
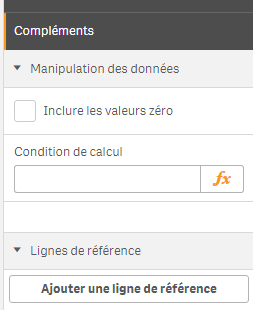
First thing, uncheck this:
and change your expression as follow:
if((SUM({<Year={$(=Max(Year))}>}Sales) - SUM({<Year={$(=Max(Year)-1)}>}Sales))>0,
(SUM({<Year={$(=Max(Year))}>}Sales) - SUM({<Year={$(=Max(Year)-1)}>}Sales)),Null())
see the attached app
- Mark as New
- Bookmark
- Subscribe
- Mute
- Subscribe to RSS Feed
- Permalink
- Report Inappropriate Content
Have you tried to uncheck show null values under complement? If that does not solve it;
Can you please share a sample QVF file?
- Mark as New
- Bookmark
- Subscribe
- Mute
- Subscribe to RSS Feed
- Permalink
- Report Inappropriate Content
Hello Omar,
I've attached a file to this message. An example would be the Head Office, who year-over-year has a negative sales value. In this case, I don't want 'Head Office' to appear in the chart.
Any help is greatly appreciated.
- Mark as New
- Bookmark
- Subscribe
- Mute
- Subscribe to RSS Feed
- Permalink
- Report Inappropriate Content
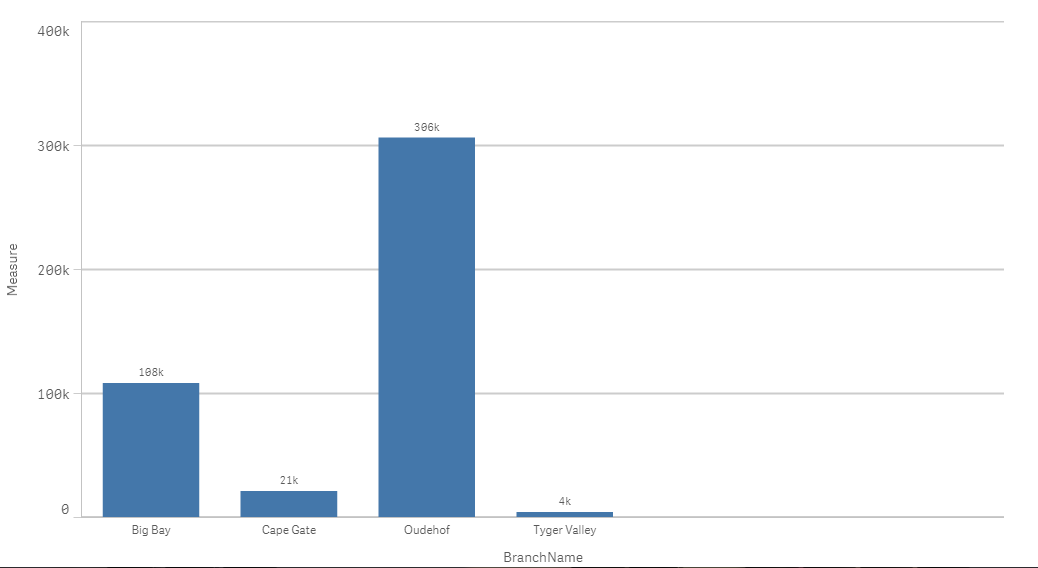
This way?
First thing, uncheck this:
and change your expression as follow:
if((SUM({<Year={$(=Max(Year))}>}Sales) - SUM({<Year={$(=Max(Year)-1)}>}Sales))>0,
(SUM({<Year={$(=Max(Year))}>}Sales) - SUM({<Year={$(=Max(Year)-1)}>}Sales)),Null())
see the attached app
- Mark as New
- Bookmark
- Subscribe
- Mute
- Subscribe to RSS Feed
- Permalink
- Report Inappropriate Content
One last question, what if I have a bar chart with multiple bars and I want to hide the value if one of the Measures is negative.
- Mark as New
- Bookmark
- Subscribe
- Mute
- Subscribe to RSS Feed
- Permalink
- Report Inappropriate Content
Same logic with each measure:
measure1 : if(expression1>0,expression1,null())
measure2 : if(expression2>0,expression2,null())
measure3 : if(expression3>0,expression3,null())