Unlock a world of possibilities! Login now and discover the exclusive benefits awaiting you.
- Qlik Community
- :
- Forums
- :
- Analytics
- :
- New to Qlik Analytics
- :
- Re: Filter out sharp spikes (outliers)
- Subscribe to RSS Feed
- Mark Topic as New
- Mark Topic as Read
- Float this Topic for Current User
- Bookmark
- Subscribe
- Mute
- Printer Friendly Page
- Mark as New
- Bookmark
- Subscribe
- Mute
- Subscribe to RSS Feed
- Permalink
- Report Inappropriate Content
Filter out sharp spikes (outliers)
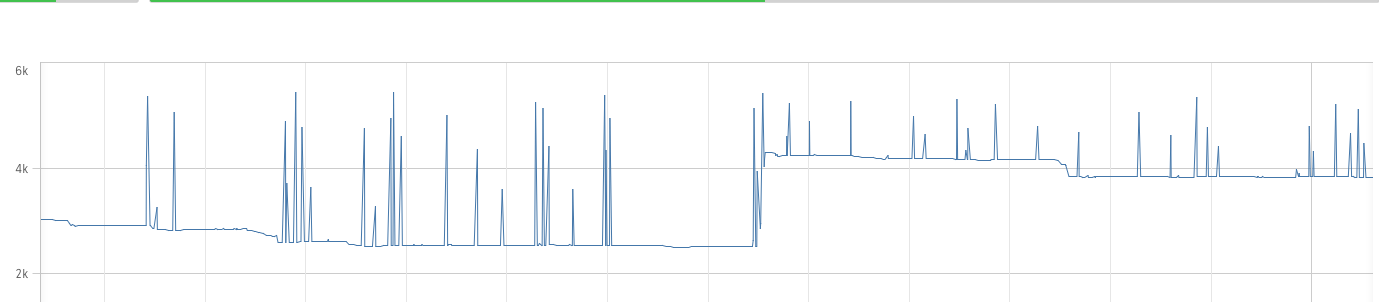
I have data that normally follows a very clear and smooth line that can slope upward and downwards but it has a lot of short and very steep spikes that distort the data (from protocol errors). I would like to ignore them in my chart, esentlially "clipping them out" of the data. For example, a typical outliner could be identified in the following data sample:
2418
2418
2419
2418
5699
2420
2418
2419
or
1418
1419
1420
1421
3566
1430
1432
1433
The ones in red are the outliers I need to filter out of my chart. There are many of those and their magnitude changes slightly over the dataset, so it is not very straight forward to just use an if/then condition to filter out the ones that are >5600 for example, as it would leave holes in the curve.
An example screenshot of my data is attached
I was hoping to be able to have a filter expression that can ignore them based on the median (or other method).
EDIT: I have added an example screen shot of the data graph with and without a very simple upper boundary IF condition (if([E7 Nivel de producto (mm)]<4000,median([E7 Nivel de producto (mm)])) that helps a bit to cleanup the curve, but it is very limited and "dumb" and will not work well for all the data.
Help is greatly appreciated!
- « Previous Replies
-
- 1
- 2
- Next Replies »
- Mark as New
- Bookmark
- Subscribe
- Mute
- Subscribe to RSS Feed
- Permalink
- Report Inappropriate Content
You can by
1. Selecting the ones you want to exclude with lasso and confirm
2. then in the filter bar at the top of your screen click on the filtered data set youve created and click the ... icon
3. Click Select Excluded and the reverse condition will become your selected
Hope this helps
- Mark as New
- Bookmark
- Subscribe
- Mute
- Subscribe to RSS Feed
- Permalink
- Report Inappropriate Content
In that case, would an expression like avg(metric) in the range work? Instead of hard-coding a number, let it display a range where the min is avg(metric)*.5 and the max is avg(metric)*2.
- Mark as New
- Bookmark
- Subscribe
- Mute
- Subscribe to RSS Feed
- Permalink
- Report Inappropriate Content
How about using a moving mean and std deviation and allow the data to be with in a certain number of std deviations away from the mean?
- Mark as New
- Bookmark
- Subscribe
- Mute
- Subscribe to RSS Feed
- Permalink
- Report Inappropriate Content
Jonathan, that is a good idea. The million dollar question is: what would that expression look like in Qlik?  I am new to Clik so I am not sure how to write that math.
Thank you for your suggestion, I´d like to try it and post the results on this blow for everyone else.
- « Previous Replies
-
- 1
- 2
- Next Replies »