Unlock a world of possibilities! Login now and discover the exclusive benefits awaiting you.
- Qlik Community
- :
- Forums
- :
- Analytics
- :
- New to Qlik Analytics
- :
- Re: How to hide specific values in a stacked bar c...
- Subscribe to RSS Feed
- Mark Topic as New
- Mark Topic as Read
- Float this Topic for Current User
- Bookmark
- Subscribe
- Mute
- Printer Friendly Page
- Mark as New
- Bookmark
- Subscribe
- Mute
- Subscribe to RSS Feed
- Permalink
- Report Inappropriate Content
How to hide specific values in a stacked bar chart?
Hello Community,
i have created a stacked bar chart where i have different "status" for different "days".
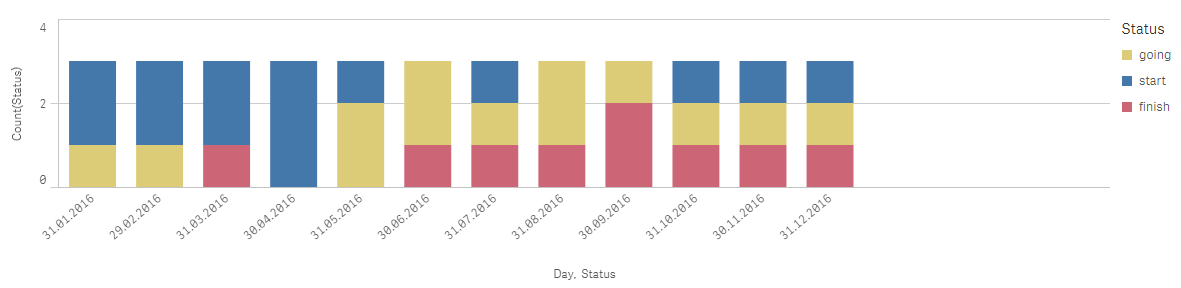
I dont want to show if a day has only the status "start" like the 30.04.2016 in the picture.
How can i hide this?
Tank you really much for your help!
Greetings,
Florian
- Mark as New
- Bookmark
- Subscribe
- Mute
- Subscribe to RSS Feed
- Permalink
- Report Inappropriate Content
but it won't hide the day.
Tomasz
- Mark as New
- Bookmark
- Subscribe
- Mute
- Subscribe to RSS Feed
- Permalink
- Report Inappropriate Content
i forgot to say to uncheck "Include zero values" option.
- Mark as New
- Bookmark
- Subscribe
- Mute
- Subscribe to RSS Feed
- Permalink
- Report Inappropriate Content
bu i want to keep the "start" status from the other fields, if a day has more than 1 status
- Mark as New
- Bookmark
- Subscribe
- Mute
- Subscribe to RSS Feed
- Permalink
- Report Inappropriate Content
yes that's why I wrote as below:
count( distinct Status) = 1 and Status = 'Start'
it means only Days with only one status equal to 'Start' will be hide.
- Mark as New
- Bookmark
- Subscribe
- Mute
- Subscribe to RSS Feed
- Permalink
- Report Inappropriate Content
yes, but the status "start" is complete missing in the other dates too now.
- Mark as New
- Bookmark
- Subscribe
- Mute
- Subscribe to RSS Feed
- Permalink
- Report Inappropriate Content
maybe I didn't understand your data model because It should works.
- Mark as New
- Bookmark
- Subscribe
- Mute
- Subscribe to RSS Feed
- Permalink
- Report Inappropriate Content
'count( distinct Status)' in condition will be calculated for every dimension value - so it would be 1 for every day - that's why 'Start' disappeared.
- Mark as New
- Bookmark
- Subscribe
- Mute
- Subscribe to RSS Feed
- Permalink
- Report Inappropriate Content
ok then try with:
count( TOTAL <Day> distinct Status) = 1 and Status = 'Start'
- Mark as New
- Bookmark
- Subscribe
- Mute
- Subscribe to RSS Feed
- Permalink
- Report Inappropriate Content
This is working!! Cool 
- Mark as New
- Bookmark
- Subscribe
- Mute
- Subscribe to RSS Feed
- Permalink
- Report Inappropriate Content
=if( count( TOTAL <Day> distinct Status) = 1 and Status = 'Start', 0, count( Status ) )