Unlock a world of possibilities! Login now and discover the exclusive benefits awaiting you.
- Qlik Community
- :
- Forums
- :
- Analytics
- :
- New to Qlik Analytics
- :
- Re: How to make bucketing in Frontend...
- Subscribe to RSS Feed
- Mark Topic as New
- Mark Topic as Read
- Float this Topic for Current User
- Bookmark
- Subscribe
- Mute
- Printer Friendly Page
- Mark as New
- Bookmark
- Subscribe
- Mute
- Subscribe to RSS Feed
- Permalink
- Report Inappropriate Content
How to make bucketing in Frontend...
Hi
I have attached the data Set below & also the app which i have made in Qlik Sense. So can you please tell me how to to this and also i want to make the below charts in my app.
- Mark as New
- Bookmark
- Subscribe
- Mute
- Subscribe to RSS Feed
- Permalink
- Report Inappropriate Content
Hello Gulshan,
Trust that you are doing well!
You can refer below given expression on the dimension field present in the Bar Chart (Day field as Dimension):
=Replace(Class(Day, 10),'<= x <', '-') & 'Days Bucket'
Hope this will help.
Regards!
Rahul
- Mark as New
- Bookmark
- Subscribe
- Mute
- Subscribe to RSS Feed
- Permalink
- Report Inappropriate Content
Hi Rahul,
Can you explain me the whole scenario. Actually the difference between each bucket is not equal so how can i write the code. and i want to calculate the bucketing on outstanding Amount
- Mark as New
- Bookmark
- Subscribe
- Mute
- Subscribe to RSS Feed
- Permalink
- Report Inappropriate Content
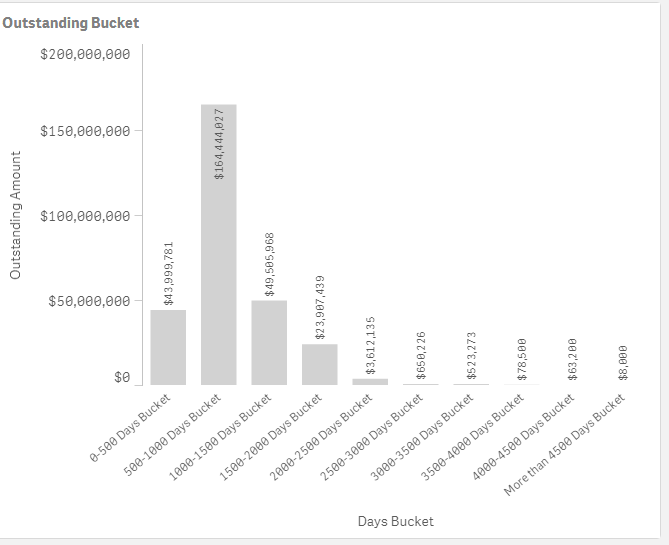
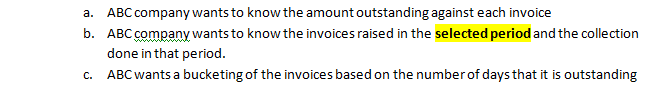
Actually below are my requirements. First one i have already done. the rest two are pending which requires bucketing. and i have calculated the outstanding amount on frontend bu set analysis. can you help in rest of the two
- Mark as New
- Bookmark
- Subscribe
- Mute
- Subscribe to RSS Feed
- Permalink
- Report Inappropriate Content
D -- Replace(Class(Day, 10),'<= x <', '-') & 'Days Bucket'
M --- Sum(Amount)
- Mark as New
- Bookmark
- Subscribe
- Mute
- Subscribe to RSS Feed
- Permalink
- Report Inappropriate Content
Hello Gulshan,
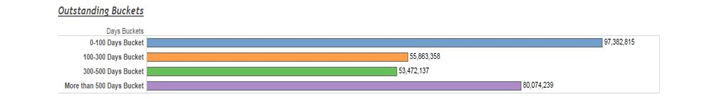
In case of uneven buckets you can write the calculated dimension as (Result of Today()-[Invoice Date] will give us the Days overdue):
If(Today()-[Invoice Date] >=0 AND Today()-[Invoice Date]<=100, '0-100 Days Bucket',
If(Today()-[Invoice Date] >=101 AND Today()-[Invoice Date]<=300, '101-300 Days Bucket',
If(Today()-[Invoice Date] >=301 AND Today()-[Invoice Date]<=500, '301-500 Days Bucket',
'More than 500 Days Bucket')))
Post this you can use below given expression for Total Outstanding Amount:
SUM({$<FLAG = {'Invoice'}>}Amount) - SUM({$<FLAG = {'Collection'}>}Amount)
For further details please refer below given link:
If you still have any issues then please let me know.
Regards!
Rahul
- Mark as New
- Bookmark
- Subscribe
- Mute
- Subscribe to RSS Feed
- Permalink
- Report Inappropriate Content
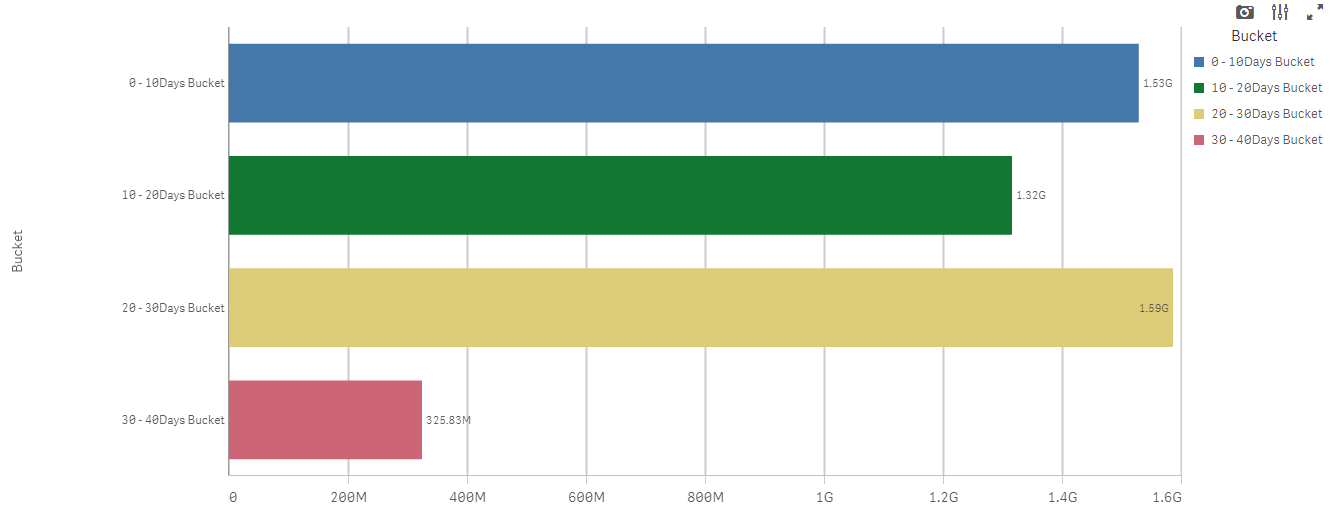
Hi Rahul,
It is working Properly but one thing is not working i.e. color coding. When I applied color by dimension then it gives me the same color on every bar and the legends are not there even if i already selected the show legends option. below is the screenshot of the chart that I made :-