Unlock a world of possibilities! Login now and discover the exclusive benefits awaiting you.
- Qlik Community
- :
- Forums
- :
- Analytics
- :
- New to Qlik Analytics
- :
- Re: How to put different dimension into one column...
- Subscribe to RSS Feed
- Mark Topic as New
- Mark Topic as Read
- Float this Topic for Current User
- Bookmark
- Subscribe
- Mute
- Printer Friendly Page
- Mark as New
- Bookmark
- Subscribe
- Mute
- Subscribe to RSS Feed
- Permalink
- Report Inappropriate Content
How to put different dimension into one column at the same time
Dear QS Experts
I am new to Qlik Sense and I am a front end user which means I don't need to import data by script from back end side
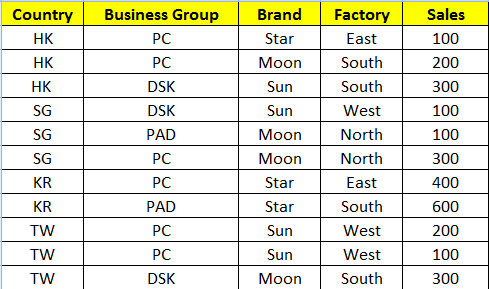
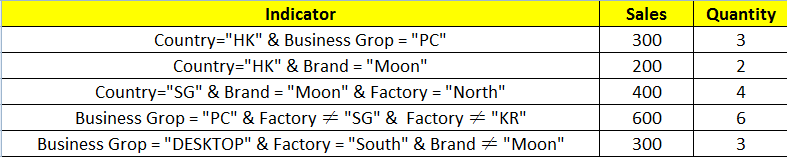
Now my raw data is as below
The result I need is as below. The indications are the dimensions I need and I need to put them all in the same pivot table at the same time so that I can show a specific table for my client as he requests
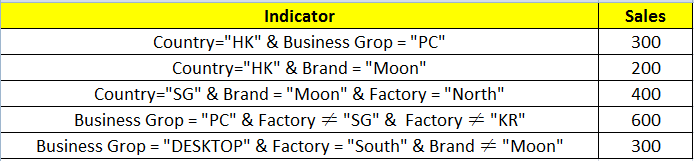
The requests are as below.
1. Use expression in master item (dimension)
2. All the indicators above should exit at the same time which means
a. I can't use bookmark for each indicator to show the data I need one by one (in each bookmark)
b. I can't use below selection to achieve each indicator by selecting them (as we can only have one result each time)
So may I know if its possible to put different fixed dimension (with expression) under one column at the same time in Qlik Sense?
If so, how can we do so?
Thank you for you advise in advance
Ivan
Best Regards
- « Previous Replies
-
- 1
- 2
- Next Replies »
Accepted Solutions
- Mark as New
- Bookmark
- Subscribe
- Mute
- Subscribe to RSS Feed
- Permalink
- Report Inappropriate Content
Hi Ivan,
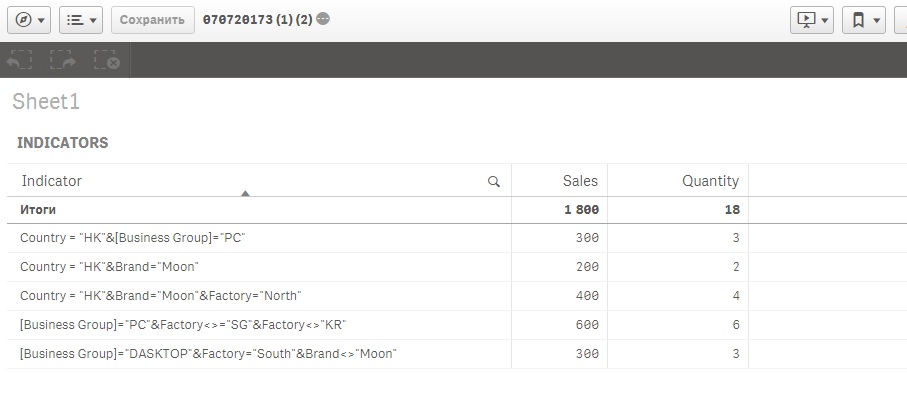
In expression for [Sales] and [Quantity] set format number "number" (not Auto default) and the function of totals SUM (look attached file).
Resalt
Regards,
Andrey
- Mark as New
- Bookmark
- Subscribe
- Mute
- Subscribe to RSS Feed
- Permalink
- Report Inappropriate Content
Hi Ivan,
May be as at attached file, but solution is not very elegant, everything is described only with hands.
Regards,
Andrey
- Mark as New
- Bookmark
- Subscribe
- Mute
- Subscribe to RSS Feed
- Permalink
- Report Inappropriate Content
Dear Andrey
Thank you so much for your reply and sorry for the late reply. It inspires me a lot
I have changed my data a little bit by adding one column which is "Quantity"
How can I show 'Sales' & 'Quantity' at the same time?
PS: I change the expression a little bit by using expression to take place of number in your previous expression
If(ValueList('Country = "HK"&[Business Group]="PC"',
'Country = "HK"&Brand="Moon"',
'Country = "HK"&Brand="Moon"&Factory="North"',
'[Business Group]="PC"&Factory<>="SG"&Factory<>"KR"',
'[Business Group]="DASKTOP"&Factory="South"&Brand<>"Moon"')='Country = "HK"&[Business Group]="PC"', sum({<Country={'HK'},[Business Group]={'PC'}>}Sales))
Thank you for your advise in advance
Ivan
- Mark as New
- Bookmark
- Subscribe
- Mute
- Subscribe to RSS Feed
- Permalink
- Report Inappropriate Content
Hi Ivan,
add new Expression like 'Sales' column with Sum({<........>} Quantity)
Regards,
Antonio
- Mark as New
- Bookmark
- Subscribe
- Mute
- Subscribe to RSS Feed
- Permalink
- Report Inappropriate Content
Dear Andrey
I can successfully change data in your original 'Sales' Column
But I failed each time when I add a 2nd column on it
Do you know which part is wrong?
Thanks
Ivan
- Mark as New
- Bookmark
- Subscribe
- Mute
- Subscribe to RSS Feed
- Permalink
- Report Inappropriate Content
Hi Ivan,
When selecting a new column, choose a new measure (not a dimension). In addition, the description of ValueList() will have to be repeated in each expression (look attached file).
Regrads,
Andrey
- Mark as New
- Bookmark
- Subscribe
- Mute
- Subscribe to RSS Feed
- Permalink
- Report Inappropriate Content
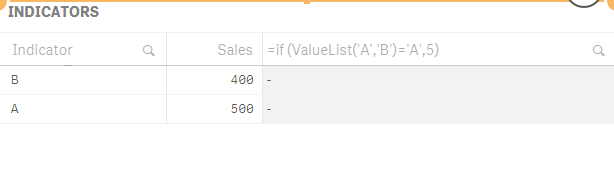
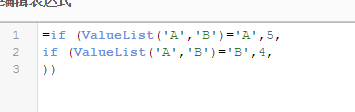
This is your example (at attahed file). In your expression, just a superfluous comma.
If(ValueList('A','B') = 'A', 5,
If(ValueList('A','B') = 'B', 4,
))
Correctly
If(ValueList('A','B') = 'A', 5,
If(ValueList('A','B') = 'B', 4
))
- Mark as New
- Bookmark
- Subscribe
- Mute
- Subscribe to RSS Feed
- Permalink
- Report Inappropriate Content
Andrey
Thank you so much for your patience and instruction
I have successfully got what I want according to your tips
There is one last question for this inquiry
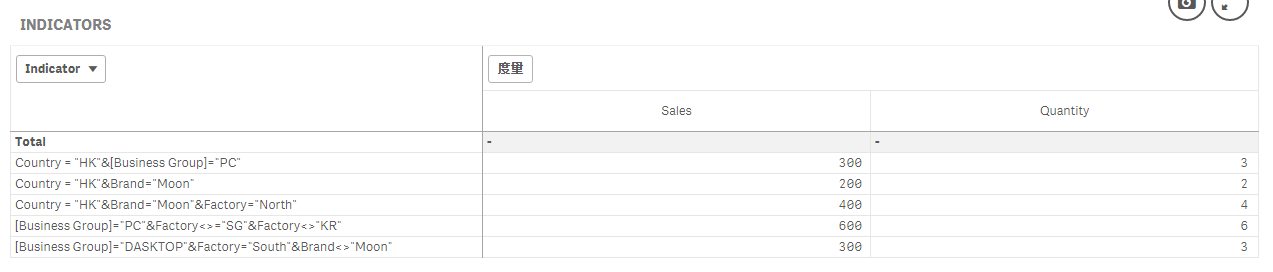
I have changed it to Pivot Table and add "Total" in "Indicator" but nothing shows up
Is there anyway to sum the contents in this Pivot Table with expression?
Thank you for your advise in advance
Ivan
- Mark as New
- Bookmark
- Subscribe
- Mute
- Subscribe to RSS Feed
- Permalink
- Report Inappropriate Content
Hi Ivan,
In expression for [Sales] and [Quantity] set format number "number" (not Auto default) and the function of totals SUM (look attached file).
Resalt
Regards,
Andrey
- Mark as New
- Bookmark
- Subscribe
- Mute
- Subscribe to RSS Feed
- Permalink
- Report Inappropriate Content
Andrey
Thanks so much!
You save me again
Ivan
- « Previous Replies
-
- 1
- 2
- Next Replies »