Unlock a world of possibilities! Login now and discover the exclusive benefits awaiting you.
- Qlik Community
- :
- Forums
- :
- Analytics
- :
- New to Qlik Analytics
- :
- Re: How to use KPI to compare this month KPI to la...
- Subscribe to RSS Feed
- Mark Topic as New
- Mark Topic as Read
- Float this Topic for Current User
- Bookmark
- Subscribe
- Mute
- Printer Friendly Page
- Mark as New
- Bookmark
- Subscribe
- Mute
- Subscribe to RSS Feed
- Permalink
- Report Inappropriate Content
How to use KPI to compare this month KPI to last month KPI dynamically?
Hi,
I have a KPI figure for revenue and I want to add another measure for last month revenue. How would I accomplish this? How might I change the color of this month revenue and glyphs when this month revenue > last month or < last month?
Thank you so much.
- Tags:
- kpi
- qlik sense
- « Previous Replies
-
- 1
- 2
- Next Replies »
- Mark as New
- Bookmark
- Subscribe
- Mute
- Subscribe to RSS Feed
- Permalink
- Report Inappropriate Content
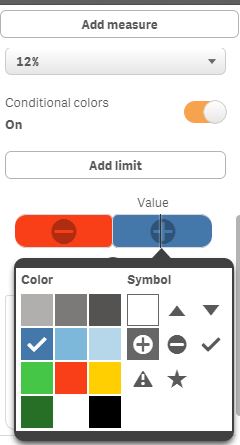
Under Measures > Your expression > 'on' conditional colors > click on the Add limit value. you will get colors and symbols. Select the symbol you want.
- Mark as New
- Bookmark
- Subscribe
- Mute
- Subscribe to RSS Feed
- Permalink
- Report Inappropriate Content
Hi Santosh, I am trying to create exactly what you're illustrated above but I'm not getting anywhere! (I'm very new to Qlik and have been enjoying the out of the box visualisations but dont really have any experience of using expressions or even really where you put them!) I've attached a .qvf in the hope you or any other willing volunteer might have time to throw those expressions in the right places and make it sing so I can see a working demo and backwards engineer it from there! Any help much appreciated, fingers crossed 
- Mark as New
- Bookmark
- Subscribe
- Mute
- Subscribe to RSS Feed
- Permalink
- Report Inappropriate Content
Hi
Is this you are looking for?
Santhosh
- Mark as New
- Bookmark
- Subscribe
- Mute
- Subscribe to RSS Feed
- Permalink
- Report Inappropriate Content
Hi Santhosh, I can't see an attachment, but maybe I'm being blind 
- Mark as New
- Bookmark
- Subscribe
- Mute
- Subscribe to RSS Feed
- Permalink
- Report Inappropriate Content
here is the attachment
- Mark as New
- Bookmark
- Subscribe
- Mute
- Subscribe to RSS Feed
- Permalink
- Report Inappropriate Content
Thanks Santhosh but I don't think that's quite what I was looking for, I'm trying to create your example above that looks like this:

- Mark as New
- Bookmark
- Subscribe
- Mute
- Subscribe to RSS Feed
- Permalink
- Report Inappropriate Content
, I'm trying to create your example above that looks like this:
Do you mean the % sign?
- Mark as New
- Bookmark
- Subscribe
- Mute
- Subscribe to RSS Feed
- Permalink
- Report Inappropriate Content
Hi
if you are are looking for color and symbol change, you can do so by selecting a name from the list and if you are looking for variance%, that you need to take difference of two different values in place of existing expressions.
Santhosh
- Mark as New
- Bookmark
- Subscribe
- Mute
- Subscribe to RSS Feed
- Permalink
- Report Inappropriate Content
No the whole thing  i.e three KPIs, one reflecting the month selection, one reflecting the previous month to the month selection, and one displaying the variance.
- « Previous Replies
-
- 1
- 2
- Next Replies »