Unlock a world of possibilities! Login now and discover the exclusive benefits awaiting you.
- Qlik Community
- :
- Forums
- :
- Analytics
- :
- New to Qlik Analytics
- :
- Re: Listing top 10 and comparison by gender
- Subscribe to RSS Feed
- Mark Topic as New
- Mark Topic as Read
- Float this Topic for Current User
- Bookmark
- Subscribe
- Mute
- Printer Friendly Page
- Mark as New
- Bookmark
- Subscribe
- Mute
- Subscribe to RSS Feed
- Permalink
- Report Inappropriate Content
Listing top 10 and comparison by gender
Dear all
I am working on a movie dataset and is struggling to display the following information on my dashboard.
My database has the following columns: MovieTitle, Gender, Ratings
I need to display the following:
List the top 10 movies that, on average, men rate higher than women.
I assume that we have to use a List Box for the above.
I created a List Box with MovieTitle as the Dimension.
I am not sure what to add to the expression such that it filters out only the top 10 movies (based on Average Ratings calculated) that men rated higher than women.
Could someone please help to provide some clear advise.
Thank you so much!
- « Previous Replies
- Next Replies »
Accepted Solutions
- Mark as New
- Bookmark
- Subscribe
- Mute
- Subscribe to RSS Feed
- Permalink
- Report Inappropriate Content
Hi Jess,
Sorry my mistake.
I thought there there is aggregated male female rating.
You will need to change the expression to:
if(Avg({<Gender={'male'}>}Rate)>Avg({<Gender={'female'}>}Rate),Avg({<Gender={'male'}>}Rate),null())
Replace only by avg.
Regards,
Pankaj
- Mark as New
- Bookmark
- Subscribe
- Mute
- Subscribe to RSS Feed
- Permalink
- Report Inappropriate Content
Maybe you can achieve what you want by creating a table chart where you use the tab "Dimension Limits" (in chart properties) to show only the 10 largest values.
- Mark as New
- Bookmark
- Subscribe
- Mute
- Subscribe to RSS Feed
- Permalink
- Report Inappropriate Content
A table with limitation seems the way to go.
How are you ranking your movies? By number of movie goers? Or by the male rating or by overall rating?
A calculated dimension something like
If(aggr(Avg({<gender={'male'}>} ratings),movietitle)>aggr(Avg({<gender={'female'}>} ratings),movietitle), movietitle,null())
Exclude nulls and set limitation fixed 10 on whatever you decide to measure your movies on should work.
- Mark as New
- Bookmark
- Subscribe
- Mute
- Subscribe to RSS Feed
- Permalink
- Report Inappropriate Content
Thank you all for the help.
Hi Andy
I created a Straight Table with Dimension MovieGenres.Title and inserted the following codes as a Calculated Dimension to that (suppress value when Null on).
N
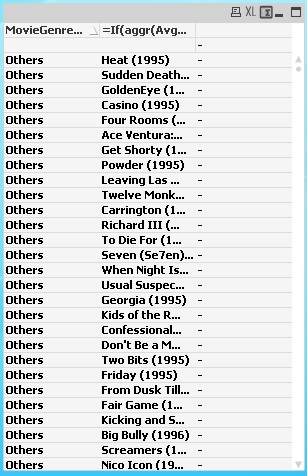
=If(aggr(Avg({<Gender={'M'}>} Rating),MovieGenres.Title)>aggr(Avg({<Gender={'F'}>} Rating),MovieGenres.Title), MovieGenres.Title,null())
I get the output table below. Is a Straight Table the best option. I tried the code on a Pivot Table and got blanks. I tried a List Box as well and it didn't work.
Where did I go wrong? 
A small sample of the data is provided below, combined data from 3 excel files.
Each User can rate more than one movie.
Each movie can be rated by many Users.
Each movie can have more than one genre
The MovieID and UserID is unique.
| MovieID | MovieGenres.Title | GenreCategory | UserID | Rating | Gender |
| 1 | Toy Story (1995) | Animation | 1 | 5 | M |
| 2 | Jumanji (1995) | Adventure | 1 | 3 | M |
| 3 | Grumpier Old Men (1995) | Comedy | 1 | 3 | F |
| 4 | Waiting to Exhale (1995) | Comedy | 2 | 4 | M |
| 5 | Father of the Bride Part II (1995) | Comedy | 34 | 5 | M |
| 6 | Heat (1995) | Action | 1 | 3 | M |
| 7 | Sabrina (1995) | Romance | 56 | 5 | M |
| 8 | Tom and Huck (1995) | Adventure | 108 | 5 | M |
| 9 | Sudden Death (1995) | Action | 2 | 4 | M |
| 10 | GoldenEye (1995) | Action | 2 | 4 | F |
| 11 | American PresidentThe (1995) | Comedy | 66 | 5 | F |
| 12 | Dracula: Dead and Loving It (1995) | Horror | 66 | 4 | M |
| 13 | Balto (1995) | Animation | 87 | 4 | M |
| 14 | Nixon (1995) | Drama | 65 | 4 | F |
| 15 | Cutthroat Island (1995) | Action | 56 | 5 | M |
| 16 | Casino (1995) | Drama | 56 | 4 | M |
| 17 | Sense and Sensibility (1995) | Romance | 200 | 3 | M |
| 18 | Four Rooms (1995) | Thriller | 200 | 4 | M |
| 19 | Ace Ventura: When Nature Calls (1995) | Comedy | 450 | 5 | M |
| 20 | Money Train (1995) | Action | 71 | 5 | F |
- Mark as New
- Bookmark
- Subscribe
- Mute
- Subscribe to RSS Feed
- Permalink
- Report Inappropriate Content
| MovieID | Title | GenreCategory | UserID | Rating | Gender |
| 1 | Toy Story (1995) | Animation | 1 | 5 | M |
| 2 | Jumanji (1995) | Adventure | 1 | 3 | M |
| 3 | Grumpier Old Men (1995) | Comedy | 1 | 3 | F |
| 4 | Waiting to Exhale (1995) | Comedy | 2 | 4 | M |
| 5 | Father of the Bride Part II (1995) | Comedy | 34 | 5 | M |
| 6 | Heat (1995) | Action | 1 | 3 | M |
| 7 | Sabrina (1995) | Romance | 56 | 5 | M |
| 8 | Tom and Huck (1995) | Adventure | 108 | 5 | M |
| 9 | Sudden Death (1995) | Action | 2 | 4 | M |
| 10 | GoldenEye (1995) | Action | 2 | 4 | F |
| 11 | American PresidentThe (1995) | Comedy | 66 | 5 | F |
| 12 | Dracula: Dead and Loving It (1995) | Horror | 66 | 4 | M |
| 13 | Balto (1995) | Animation | 87 | 4 | M |
| 14 | Nixon (1995) | Drama | 65 | 4 | F |
| 15 | Cutthroat Island (1995) | Action | 56 | 5 | M |
| 16 | Casino (1995) | Drama | 56 | 4 | M |
| 17 | Sense and Sensibility (1995) | Romance | 200 | 3 | M |
| 18 | Four Rooms (1995) | Thriller | 200 | 4 | M |
| 19 | Ace Ventura: When Nature Calls (1995) | Comedy | 450 | 5 | M |
| 20 | Money Train (1995) | Action | 71 | 5 | F |
- Mark as New
- Bookmark
- Subscribe
- Mute
- Subscribe to RSS Feed
- Permalink
- Report Inappropriate Content
Can anyone help please
- Mark as New
- Bookmark
- Subscribe
- Mute
- Subscribe to RSS Feed
- Permalink
- Report Inappropriate Content
Each Movie is only repeating once, how do you compare Men's rating vs Women's rating when only men or women rate them? Am I missing something?
- Mark as New
- Bookmark
- Subscribe
- Mute
- Subscribe to RSS Feed
- Permalink
- Report Inappropriate Content
right so first things first. Is the claculated dimension bringing out the movies where the average male rating is greater than the average female rating?
You can do this by adding the following measures to your straight table.
Average Female Rating
Avg({<Gender={'M'}>} Rating)
Average Female Rating
Avg({<Gender={'F'}>} Rating)
You should see only movies that have a Male rating > female
Next you said you wanted top 10 movies, What is your Top 10 based on?
If you mockup up what you want it to look like in excel it might be easier to give you the guidence you seek.
- Mark as New
- Bookmark
- Subscribe
- Mute
- Subscribe to RSS Feed
- Permalink
- Report Inappropriate Content
Hi Summy
The table is only a sample data. The listing goes on to thousands.
Each movie can be repeated as many times as each user rates it.
- Mark as New
- Bookmark
- Subscribe
- Mute
- Subscribe to RSS Feed
- Permalink
- Report Inappropriate Content
It might be helpful to see some raw data where you have repeating information for movie based on M or W and then let us know the output you are looking to get. Difficult to see how you determine top 10 here?
- « Previous Replies
- Next Replies »