Unlock a world of possibilities! Login now and discover the exclusive benefits awaiting you.
- Qlik Community
- :
- Forums
- :
- Analytics
- :
- New to Qlik Analytics
- :
- Re: Period filter dropdown implementation
- Subscribe to RSS Feed
- Mark Topic as New
- Mark Topic as Read
- Float this Topic for Current User
- Bookmark
- Subscribe
- Mute
- Printer Friendly Page
- Mark as New
- Bookmark
- Subscribe
- Mute
- Subscribe to RSS Feed
- Permalink
- Report Inappropriate Content
Period filter dropdown implementation
Hi All,
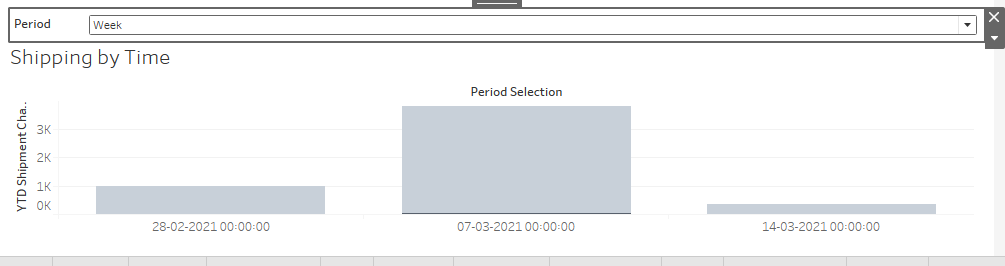
I am new to qlik sense but have been using Tableau. In tableau, we have a functionality where selected a period, data split by the period is displayed. Example: Day filter will give day wise graph, Week filter will give week wise graph.
Please suggest how do I implement this. My data is as in the attached excel
Regards,
Ashwini
- Mark as New
- Bookmark
- Subscribe
- Mute
- Subscribe to RSS Feed
- Permalink
- Report Inappropriate Content
Hi @AshwiniMadhusudhan !
In Qlik Sense you have to do it combining a "bar chart" with "variable input" component.
Look at this example attached.
You also can use this combination with any chart.
- Mark as New
- Bookmark
- Subscribe
- Mute
- Subscribe to RSS Feed
- Permalink
- Report Inappropriate Content
Thanks a lot @joaopaulo_delco This is really helpful
If I have to add a custom date filter in the same how do I do it
I also have the question, if I want Last Month, Last Week as filters
Regards,
Ashwini
- Mark as New
- Bookmark
- Subscribe
- Mute
- Subscribe to RSS Feed
- Permalink
- Report Inappropriate Content
Hi @AshwiniMadhusudhan !
To put new fields to change the dimensions you should add new fields in the values of the "variable input".
Look at the image attatched.