Unlock a world of possibilities! Login now and discover the exclusive benefits awaiting you.
- Qlik Community
- :
- Forums
- :
- Analytics
- :
- New to Qlik Analytics
- :
- Re: Qlik Sense CPU Utilization
- Subscribe to RSS Feed
- Mark Topic as New
- Mark Topic as Read
- Float this Topic for Current User
- Bookmark
- Subscribe
- Mute
- Printer Friendly Page
- Mark as New
- Bookmark
- Subscribe
- Mute
- Subscribe to RSS Feed
- Permalink
- Report Inappropriate Content
Qlik Sense CPU Utilization
Hello,
Is there any app or a smart way to monitor that which application or user is causing 100 % CPU utilization for Qliksense server.
TIA
Accepted Solutions
- Mark as New
- Bookmark
- Subscribe
- Mute
- Subscribe to RSS Feed
- Permalink
- Report Inappropriate Content
From my vantage point (selfishly no doubt since my team has created it), the Qlik Sense Telemetry Dashboard (https://github.com/eapowertools/qs-telemetry-dashboard/) is the best tool for the job. Now the resulting information will not be in percentage terms, mostly because that isn't a super helpful measure by my estimation. The ultimate care isn't what precise % of available compute is used, it's how long do users have to wait.If the system could be pegged at 100% for the rest of time and every user got a response time of under 2 seconds, then that would not be a bad state of affairs. For a primer on what the dashboard provides, do review this video: https://youtu.be/2BfZDxODhzE
There are other methods for measuring idealized response times for a Qlik app (Qlik Scalability Tools, Rob Wunderlich's Document Analyzer), but those are providing a slightly different data set. They focus on, in an idealized scenario, what is the response time of an object. When doing regression testing or performance tuning, it's ideal to have this isolation so that you can have a baseline between trial X and trial X+1.
But for day-to-day awareness of what objects (think visualizations) and apps are the most computationally expensive, then the Telemetry Dashboard are my preferred tool.
- Mark as New
- Bookmark
- Subscribe
- Mute
- Subscribe to RSS Feed
- Permalink
- Report Inappropriate Content
Hi Avneet,
Don't the monitoring apps from Qlik help with this?
Problems for this can be:
- Large applications
- Applications with a lot of front-end calculations (Aggr etc.)
Jordy
Climber
- Mark as New
- Bookmark
- Subscribe
- Mute
- Subscribe to RSS Feed
- Permalink
- Report Inappropriate Content
From my vantage point (selfishly no doubt since my team has created it), the Qlik Sense Telemetry Dashboard (https://github.com/eapowertools/qs-telemetry-dashboard/) is the best tool for the job. Now the resulting information will not be in percentage terms, mostly because that isn't a super helpful measure by my estimation. The ultimate care isn't what precise % of available compute is used, it's how long do users have to wait.If the system could be pegged at 100% for the rest of time and every user got a response time of under 2 seconds, then that would not be a bad state of affairs. For a primer on what the dashboard provides, do review this video: https://youtu.be/2BfZDxODhzE
There are other methods for measuring idealized response times for a Qlik app (Qlik Scalability Tools, Rob Wunderlich's Document Analyzer), but those are providing a slightly different data set. They focus on, in an idealized scenario, what is the response time of an object. When doing regression testing or performance tuning, it's ideal to have this isolation so that you can have a baseline between trial X and trial X+1.
But for day-to-day awareness of what objects (think visualizations) and apps are the most computationally expensive, then the Telemetry Dashboard are my preferred tool.
- Mark as New
- Bookmark
- Subscribe
- Mute
- Subscribe to RSS Feed
- Permalink
- Report Inappropriate Content
@Levi_Turner : We use the Telemetry Dashboard for "frontend"(objectID) evaluation (in combination with Add Sense from erikwett). Nice tool.
BUT i would not recommend it for Monitoring. (Maybe the EngineLogs are not complete... Logging@Info)
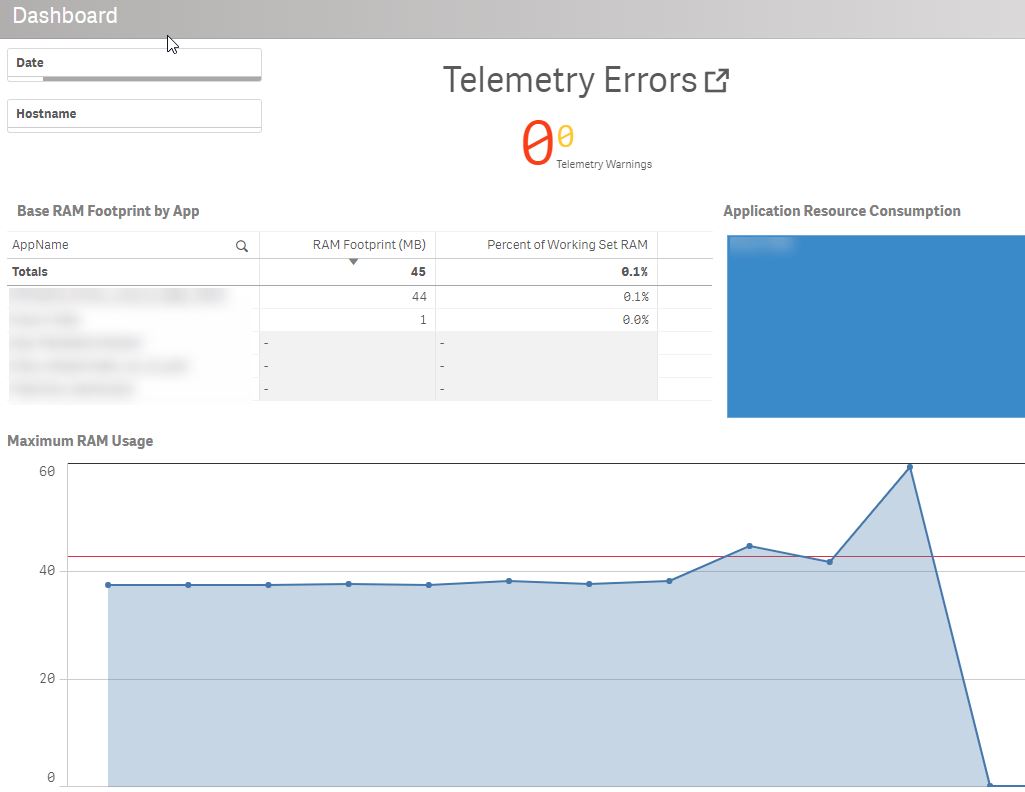
We didn't find a way in Qlik, to monitor the CPU and RAM Usage of an App. (You can track all active Apps and the CPU & RAM Usage on the System. Healtcheck Infos.)
Take a look at my Screenshot. 60 GB RAM used. App RAM Footprint@45MB. No Telemetry Errors or Warnings. (Parameters are default)
ErrorPeakMemory=2147483648
WarningPeakMemory=1073741824
ErrorProcessTimeMs=60000
WarningProcessTimeMs=30000
- Mark as New
- Bookmark
- Subscribe
- Mute
- Subscribe to RSS Feed
- Permalink
- Report Inappropriate Content
Hi @Levi_Turner ,
This actually looks very cool. Is it free? Does it work with Qlik Sense Enterprise and if so, does it exchange any data with third parties?
Regards,
Vitalii
- Mark as New
- Bookmark
- Subscribe
- Mute
- Subscribe to RSS Feed
- Permalink
- Report Inappropriate Content
> This actually looks very cool. Is it free?
Yes, it is free.
> Does it work with Qlik Sense Enterprise
Yes, it works with Qlik Sense Enterprise on Windows.
> and if so, does it exchange any data with third parties?
No, it does not.
- Mark as New
- Bookmark
- Subscribe
- Mute
- Subscribe to RSS Feed
- Permalink
- Report Inappropriate Content
Thank you, @Levi!
- Mark as New
- Bookmark
- Subscribe
- Mute
- Subscribe to RSS Feed
- Permalink
- Report Inappropriate Content
WoWizer TPM will help you in identifying apps and objects which are having performance issue in Realtime (RAM/CPU).
Examine App-level CPU/RAM metrics in real time to shortlist those which need Optimization.
You can check out WoWizer TPM product, Below is the link for the same.
Regards,
Nirav Bhimani