Unlock a world of possibilities! Login now and discover the exclusive benefits awaiting you.
- Qlik Community
- :
- Forums
- :
- Analytics
- :
- New to Qlik Analytics
- :
- Re: Qlik Sense - No colours in stacked bar
- Subscribe to RSS Feed
- Mark Topic as New
- Mark Topic as Read
- Float this Topic for Current User
- Bookmark
- Subscribe
- Mute
- Printer Friendly Page
- Mark as New
- Bookmark
- Subscribe
- Mute
- Subscribe to RSS Feed
- Permalink
- Report Inappropriate Content
Qlik Sense - No colours in stacked bar
Hi,
I am currently trying to create a multicoloured stacked bar chart, but when I select the stacked option all colours disappear and I'm left with a stacked grey chart.
If I click the grouped option, they will divide and each have colours, so I don't really know what the problem is...
Thanks!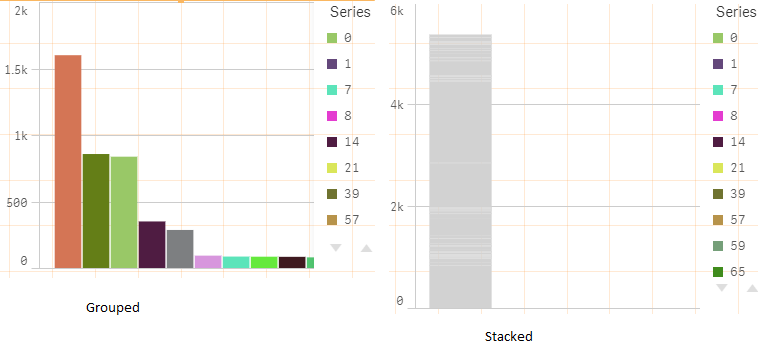
- Mark as New
- Bookmark
- Subscribe
- Mute
- Subscribe to RSS Feed
- Permalink
- Report Inappropriate Content
looks odd. How many Series (dimension) values are there? it looks as if all the colors are getting mixed and causing problems (which is weird in itself)
Would raise a ticket
- Mark as New
- Bookmark
- Subscribe
- Mute
- Subscribe to RSS Feed
- Permalink
- Report Inappropriate Content
In that specific pic there are lots of them, probably more than 100, but I have tried limiting the series to 10 for example and the same problem happens, you can perfectly see the 10 stacks in the bar, but all grey.
- Mark as New
- Bookmark
- Subscribe
- Mute
- Subscribe to RSS Feed
- Permalink
- Report Inappropriate Content
With multi color use same dimension as what you have in original dimension and check box for 'Persistent Color'
- Mark as New
- Bookmark
- Subscribe
- Mute
- Subscribe to RSS Feed
- Permalink
- Report Inappropriate Content
are you using color by dimension? or expression?